Fit Surface Accuracy
Verify the accuracy of a fit surface response.
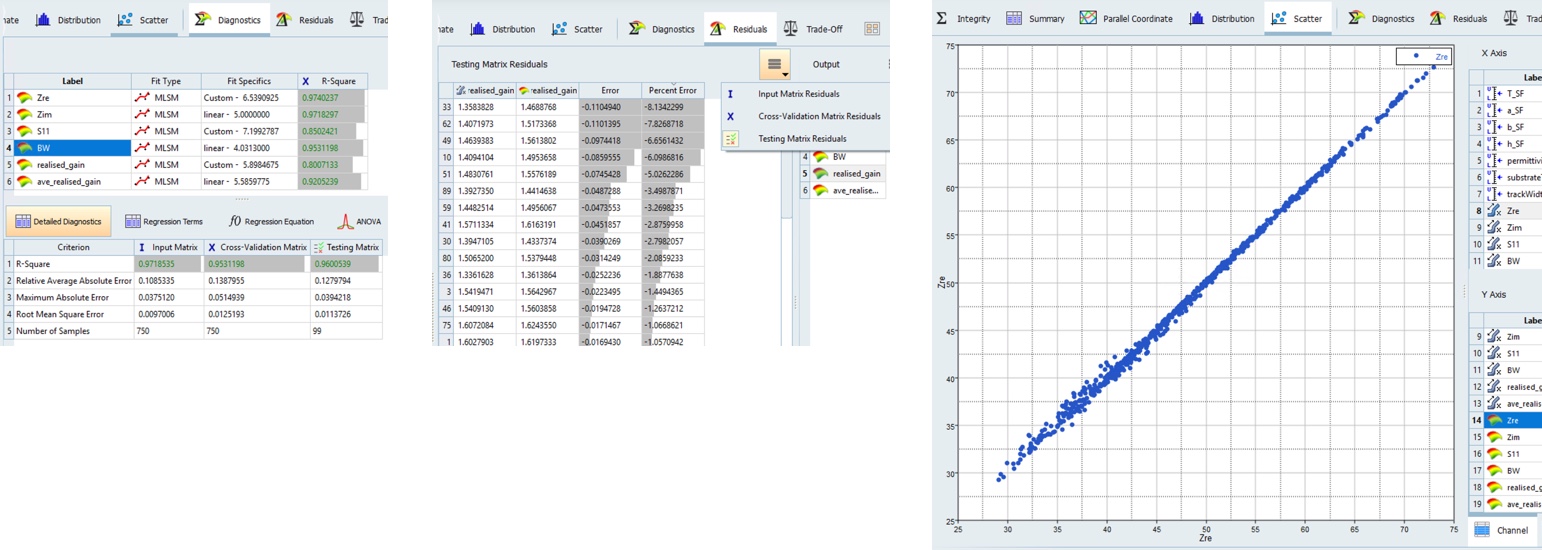
Figure 1. Checking the fit surface accuracy.
-
- Diagnostics
- Diagnostics shows various statistics to help assess the accuracy and errors associated with the fit surfaces for each response. These include R-Squared, which for a perfect fit would be equal to 1, but values ≥ 0.9 are typically sufficient.
-
- Residuals
- Residuals show the error and percentage error between the actual responses computed by Feko and the corresponding values of response from the fit surface.
-
- Scatter Plot
- A scatter plot can be used to plot the simulated responses against the corresponding surface response values. Ideally, the scatter plot should show a one-to-one plot over the range of the response, and is therefore a good visual indicator of how significant any errors may be and also in what range of the response values they may occur.
Note: If the accuracy of the fit surface is insufficient, add an additional DOE to
extend the initial DOE.
In the Specifications, select the Use Inclusion Matrix check box and import the values from the initial DOE.