Viewing the Input Reflection Coefficient
View the input reflection coefficient on a Cartesian graph in dB.
-
On the Home tab, in the
Create new display group, click the
 Cartesian icon.
-
On the Home tab, in the
Add results group, click the
 Source data icon. From the drop-down list, select
VoltageSource1.
Source data icon. From the drop-down list, select
VoltageSource1.
-
View the input reflection coefficient in dB versus frequency.
- On the result palette, in the Traces panel, select VoltageSource1.
- On the Quantity panel, confirm that Reflection coefficient is selected (default option).
- On the Quantity panel, select the dB check box.
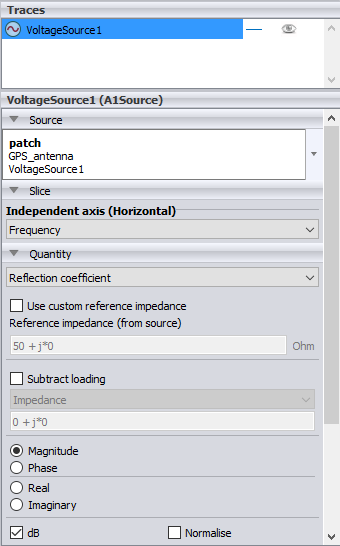
Figure 1. The result palette containing the Traces, Source, Slice and Quantity panels (listed from top to bottom). -
Change the legend position to bottom-right.
-
On the Display tab, in the
Display group, click the
 Position icon. From the drop-down list select Overlay
bottom right.
Position icon. From the drop-down list select Overlay
bottom right.
-
On the Display tab, in the
Display group, click the
-
Remove the graph footer.
-
On the Display tab, in the
Display group, click the
 Chart text
icon.
Chart text
icon.
- In the Graph footer field, clear the Auto check box and delete the text.
- Click OK to apply the text changes and to close the dialog.
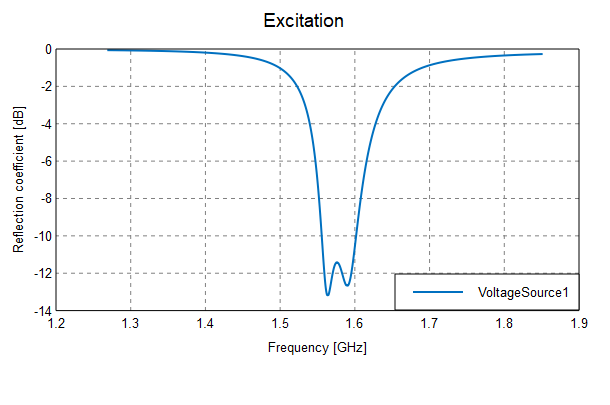
Figure 2. The input reflection coefficient in dB versus frequency. -
On the Display tab, in the
Display group, click the