The Powders Starter Pack
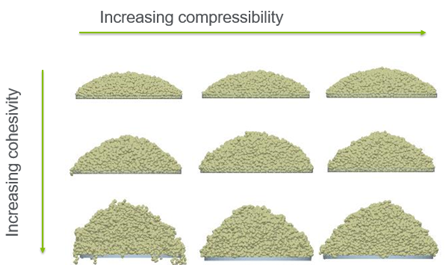
The Powders Starter Pack consists of 9 material models with the following range of behaviors.
The simulation decks can be found in the following installation directory:
C:\Program Files\Altair\2022.2\EDEM\bin\examples\Powders Starter Pack.
To use these material models in a simulation, copy them into the material library (see material library) or you can modify the simulation deck provided.
Material Properties
The following table lists the comprises 9 material models with the following simulation range of behavior.
| Material | Untapped Bulk Density (kg/m3) | Tapped Bulk Density (kg/m3) | Angle of Repose (degrees) | Compressibility | Flow Character |
|
1 |
678 |
733 |
27.5 |
Incompressible |
Excellent |
|
2 |
675 |
715 |
29 |
Compressible |
Excellent |
|
3 |
676 |
711 |
28.5 |
Very compressible |
Excellent |
|
4 |
604 |
659 |
39 |
Incompressible |
Fair |
|
5 |
619 |
662 |
37 |
Compressible |
Fair |
|
6 |
613 |
650 |
35 |
Very compressible |
Fair/Good |
|
7 |
514 |
593 |
50+ |
Incompressible |
Poor |
|
8 |
523 |
628 |
50+ |
Compressible |
Poor |
|
9 |
532 |
637 |
50+ |
Very compressible |
Poor |
|
|
Non-compressible |
Mid-compressible |
Highly-compressible |
|
Non-cohesive |
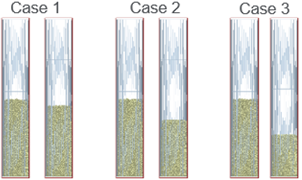
Case 1 |
Case 2 |
Case 3 |
|
Mid-cohesive |
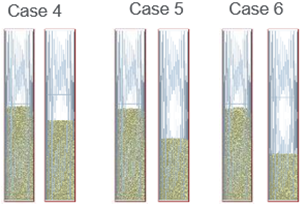
Case 4 |
Case 5 |
Case 6 |
|
Highly-cohesive |
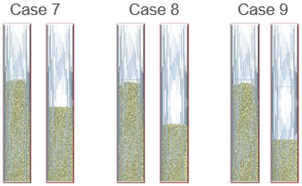
Case7 |
Case 8 |
Case 9 |
|
Case |
Sample height before compression (mm) |
Sample height after compression (mm) |
Amount of compression (%) |
Compression Ratio |
Carr Index (%) |
Hausner Ratio |
Flow Character |
|
1 |
91 |
83 |
0.09 |
1.1 |
7.50 |
1.08 |
Excellent |
|
2 |
91 |
66 |
0.28 |
1.4 |
5.59 |
1.06 |
Excellent |
|
3 |
91 |
49 |
0.47 |
1.9 |
4.92 |
1.05 |
Excellent |
|
4 |
102 |
87 |
0.15 |
1.2 |
8.34 |
1.09 |
Excellent |
|
5 |
100 |
67 |
0.33 |
1.5 |
6.49 |
1.07 |
Excellent |
|
6 |
101 |
50 |
0.50 |
2.0 |
5.69 |
1.06 |
Excellent |
|
7 |
120 |
88 |
0.27 |
1.4 |
13.32 |
1.15 |
Good |
|
8 |
118 |
67 |
0.43 |
1.8 |
16.71 |
1.20 |
Fair |
|
9 |
116 |
49 |
0.58 |
2.4 |
16.48 |
1.19 |
Fair |
These consist of a series of particle-particle and particle-geometry interactions to obtain the relevant material behavior.
Material-Material Interaction Parameters
|
Powder |
EEPA Surface Energy (J/m2) |
EEPA Constant pull-off force (N) |
EEPA Contact Plasticity Ratio |
EEPA Slope Exp |
EEPA Tensile Exp |
EEPA Tangential Stiffness Multiplier |
Material-Material Rolling Friction |
Material-Material Static Friction |
Material-Material Restitution |
|
1 |
0 |
0 |
0.1 |
1.5 |
5 |
0.28571 |
0 |
0.3 |
0.5 |
|
2 |
0 |
0 |
0.5 |
1.5 |
5 |
0.28571 |
0 |
0.3 |
0.5 |
|
3 |
0 |
0 |
0.9 |
1.5 |
5 |
0.28571 |
0 |
0.3 |
0.5 |
|
4 |
0.05 |
-5.00E-05 |
0.1 |
1.5 |
5 |
0.28571 |
0.02 |
0.6 |
0.5 |
|
5 |
0.05 |
-5.00E-05 |
0.5 |
1.5 |
5 |
0.28571 |
0.02 |
0.6 |
0.5 |
|
6 |
0.05 |
-5.00E-05 |
0.9 |
1.5 |
5 |
0.28571 |
0.02 |
0.6 |
0.5 |
|
7 |
0.25 |
-0.0001 |
0.1 |
1.5 |
5 |
0.28571 |
0.1 |
0.84 |
0.5 |
|
8 |
0.25 |
-0.0001 |
0.5 |
1.5 |
5 |
0.28571 |
0.1 |
0.84 |
0.5 |
|
9 |
0.25 |
-0.0001 |
0.9 |
1.5 |
5 |
0.28571 |
0.1 |
0.84 |
0.5 |
Material-Geometry Interaction Parameters
|
Powder |
Material-Geometry Rolling Friction |
Material-Geometry Static Friction |
Material-Geometry Restitution |
|
1 |
0.15 |
0.36 |
0.5 |
|
2 |
0.15 |
0.36 |
0.5 |
|
3 |
0.15 |
0.36 |
0.5 |
|
4 |
0.15 |
0.84 |
0.5 |
|
5 |
0.15 |
0.84 |
0.5 |
|
6 |
0.15 |
0.84 |
0.5 |
|
7 |
0.15 |
1.4 |
0.5 |
|
8 |
0.15 |
1.4 |
0.5 |
|
9 |
0.15 |
1.4 |
0.5 |
Research has shown that values of Carr Index below 15% indicate very good flow character but values above 25% indicate poor flow. Also, Hausner ratio values of around 1.00–1.25 indicate free-flowing powder, values between 1.26–1.45 indicate poor flow, and above 1.46 are related to extremely poor flow (Carr (1965), Wells (1988), Marshall (1986). The EDEM tapped density results indicate that the overall flow character of the materials is varied between excellent to fair however, the angle of repose measurements indicates that cases 4-6 have passable flowability and cases 7-9 have very poor flowability.
Angle of repose results are displayed as follows:
Compressibility test results are displayed as follows:
Each case shows the material before compression (left) and after compression (right):
Test Descriptions
Untapped Bulk Density Test
A 100 ml cylinder created with 16 mm radius and 185 mm height. 0.05 kg of powder material was added via a funnel at the top of the cylinder at a rate of 0.2 kg/s and an initial velocity of -0.25 m/s.
The material was allowed to settle and the bulk density calculated from the height of the material in the cylinder following a standard experimental process (World Health Organisation, 2017[4]). A Time Step of 2e-6 s was used for bulk density tests.
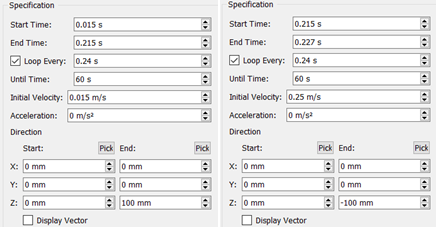
Tapped Bulk Density Test
The settled material from the untapped density test was subjected to a repeating tap. A 3 mm drop was added to the cylinder repeating every 0.24 s (250 times per minute). This was introduced to EDEM via two repeating kinematics (show below). Every 60 s the motion was paused for 2 s to allow the material to settle and the bulk density measurement taken. When the bulk density variation between measurements was negligible the tapped density was recorded. A Time Step of 5e-6 s was used for the tap tests.
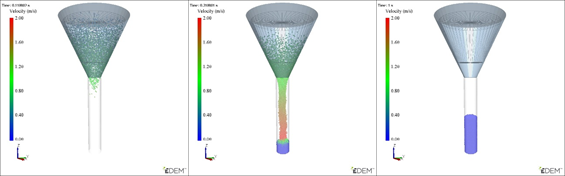
Static Repose Angle Test
0.05 kg of material was filled in a cylinder as per the untapped bulk density test. An additional cone with initial radius 16 mm and final radius 8 mm was added to the end of the cylinder to reduce the velocity at which the material exits the cylinder. The drop height from the base of the cone to the floor was set to 80 mm. The floor consists of a small cylinder with lip 2 mm in height. Initially the cylinder is filled with material with a stop at the base, the base stop is removed, and the material allowed to flow out. For cases 7-9 the material can stick in the cylinder without flowing, an additional ‘tap’ kinematic was added to enable the material to flow to gain a measurement of angle.
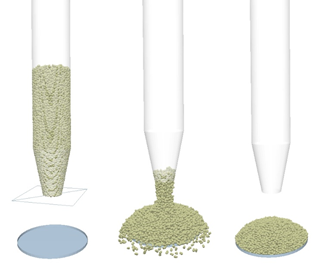
Compressibility Test
0.05 kg of material was filled in a cylinder as per the untapped bulk density test. The sample material was then compressed under a pressure of 3 MPa (using the EDEM Coupling Interface) and the final material height recorded. Amount of compression calculated from:
‘Difference in sample height’ / ‘sample height before compression’, where the difference in sample height is the difference before and after compression.
Compressibility index and Hausner ratio are calculated as follows:
‘100 x (tapped density – untapped density) / tapped density’ and ‘tapped density’ / ‘untapped desnity’ respectively.
Estimating Run Times
The recommended Time Step for a solid density of 1150 kg/m3 is:
|
Compressibility Ratio |
Time step (s) |
Cases |
|
0.1 |
8E-07 |
1,4,7 |
|
0.5 |
6E-07 |
2,5,8 |
|
0.9 |
3E-07 |
3,6,9 |
However. investigations into the Time Step suggested the compression tests and repose angel tests were unaffected by running at higher time steps, a value of 2e-6 s was used for the angle of repose tests and 5e-6 s for the tapped bulk density tests.
For different hardware, the estimated simulation run times are as follows:
|
Time step (s) |
Simulation run time (s) |
Time per iteration per particle (microseconds) |
Number of Particles |
Estimated Run Time (days) |
|
2.00E-06 |
1 |
1.2 |
1000000 |
6.9 |
|
2.00E-06 |
1 |
1 |
1000000 |
5.8 |
|
2.00E-06 |
1 |
0.8 |
1000000 |
4.6 |
|
2.00E-06 |
1 |
0.6 |
1000000 |
3.5 |
|
2.00E-06 |
1 |
0.4 |
1000000 |
2.3 |
|
2.00E-06 |
1 |
0.2 |
1000000 |
1.2 |
Number of Iterations = EDEM run time / EDEM Time Step.
Seconds Per Iteration = elapsed real time / number of iterations.
Time Per Iteration per particle = Seconds Per Iteration / Number of particles.
The time per iteration per particle can be measured from the relevant hardware setup. First setup a simulation that takes around 1000 iterations. Then use a stopwatch to measure how long the elapsed real time for the simulation is and use this to calculate time per iteration per particle.
This is typically in the range of 1 microsecond for 8-16 processors. Different values will be found depending on how many spheres are used to make up a particle shape and the type of contact model used.
According to the table, the time per iteration ranges from 1.2 which is high-end CPU’s and 0.2 which would be for a high-end GPU.