EDEM Simulator
Use EDEM Simulator to:
- Configure and control the EDEM simulation engine, and observe the progress of your simulation
- Cutting edge DEM solver, highly parallelized for use on multi-core shared memory workstations, GPU hardware, and Multi-GPU systems
- Double-precision Solver engine used across all platforms
- Simulations for large and complex particle systems
- Live viewer window to easily review progress and assess design performance
- Start and stop simulations at any time or configure data output while running a simulation
EDEM Simulator is supported by a range of time-saving tools, including the novel Dynamic Domain as well as auto-settings for key DEM solver parameters that help reduce the overall simulation run time.
- Simulator Pane
- Viewer
- Toolbar and Menu
- Solve Report
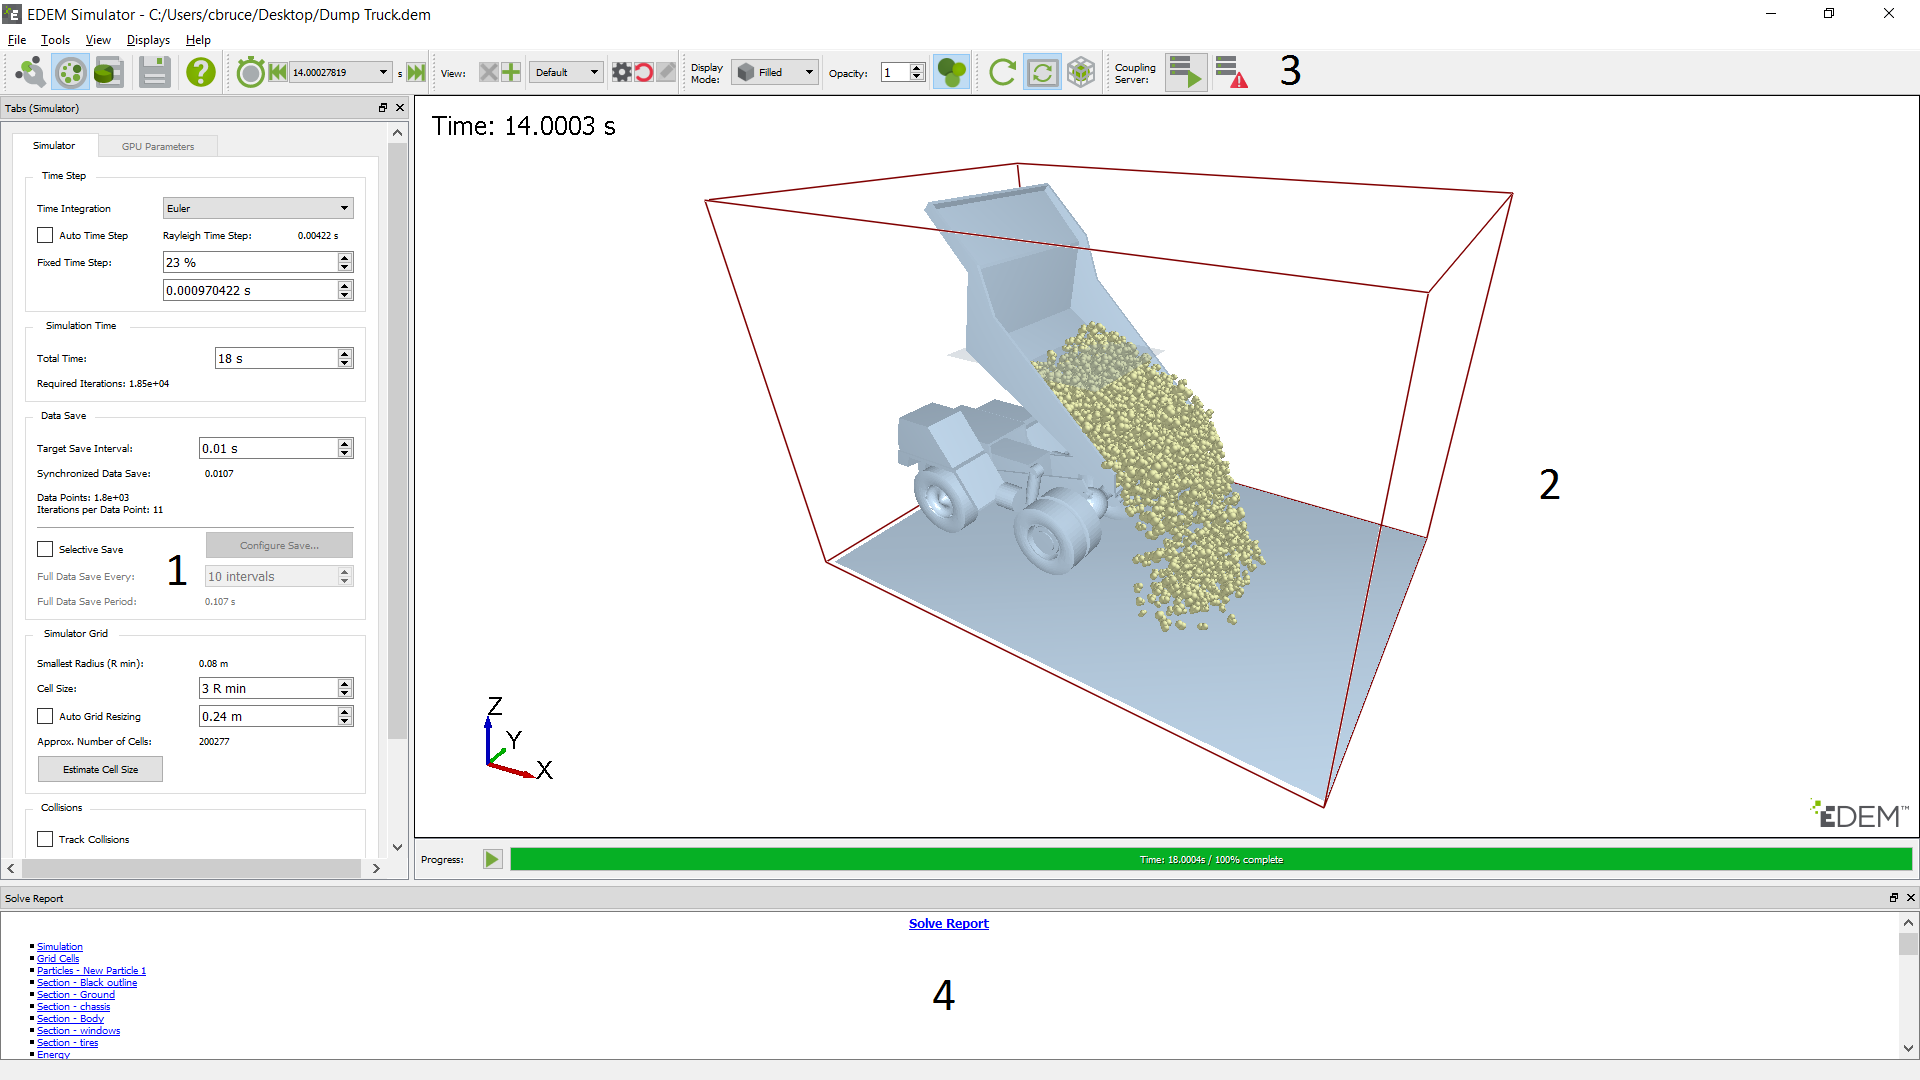
Simulator Pane
The Simulator Pane is where the Time Step, simulation time, grid options and Simulator Engine are set for the CPU mode or the GPU parameters are set.
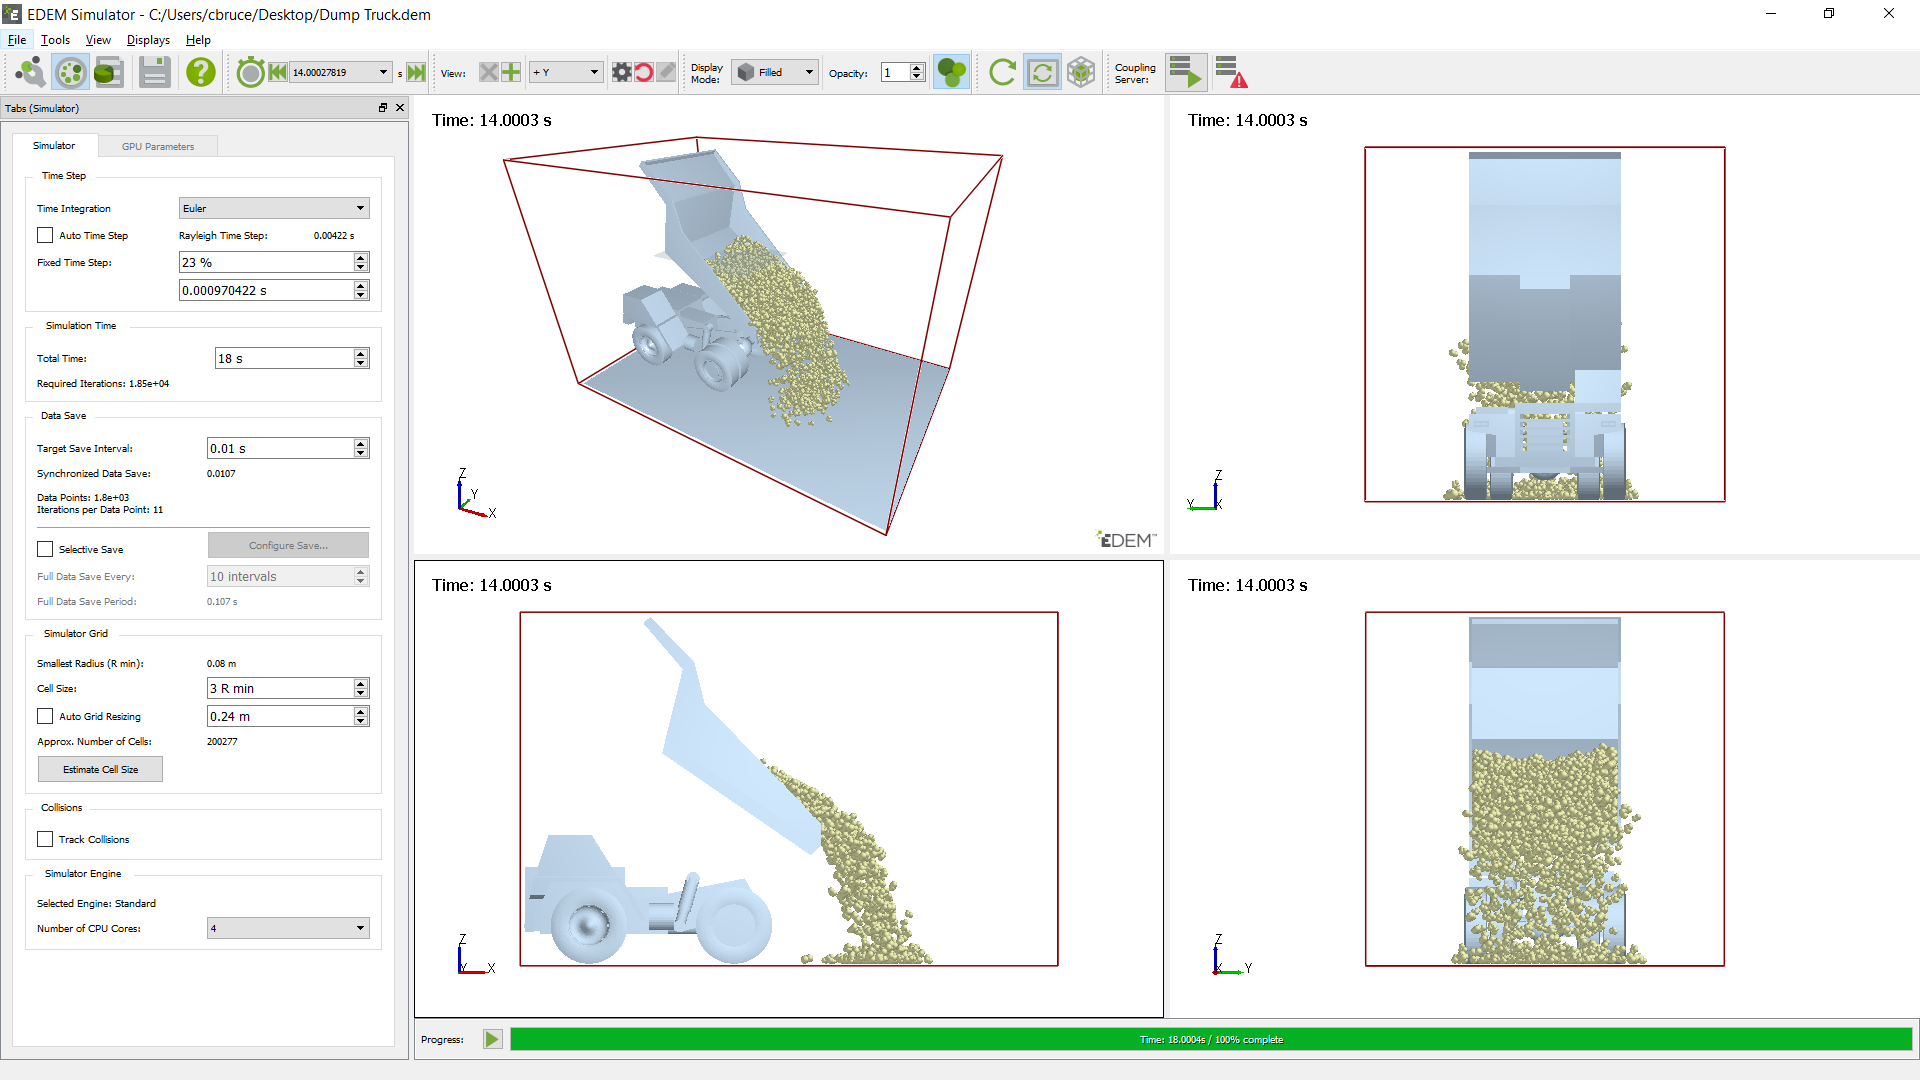
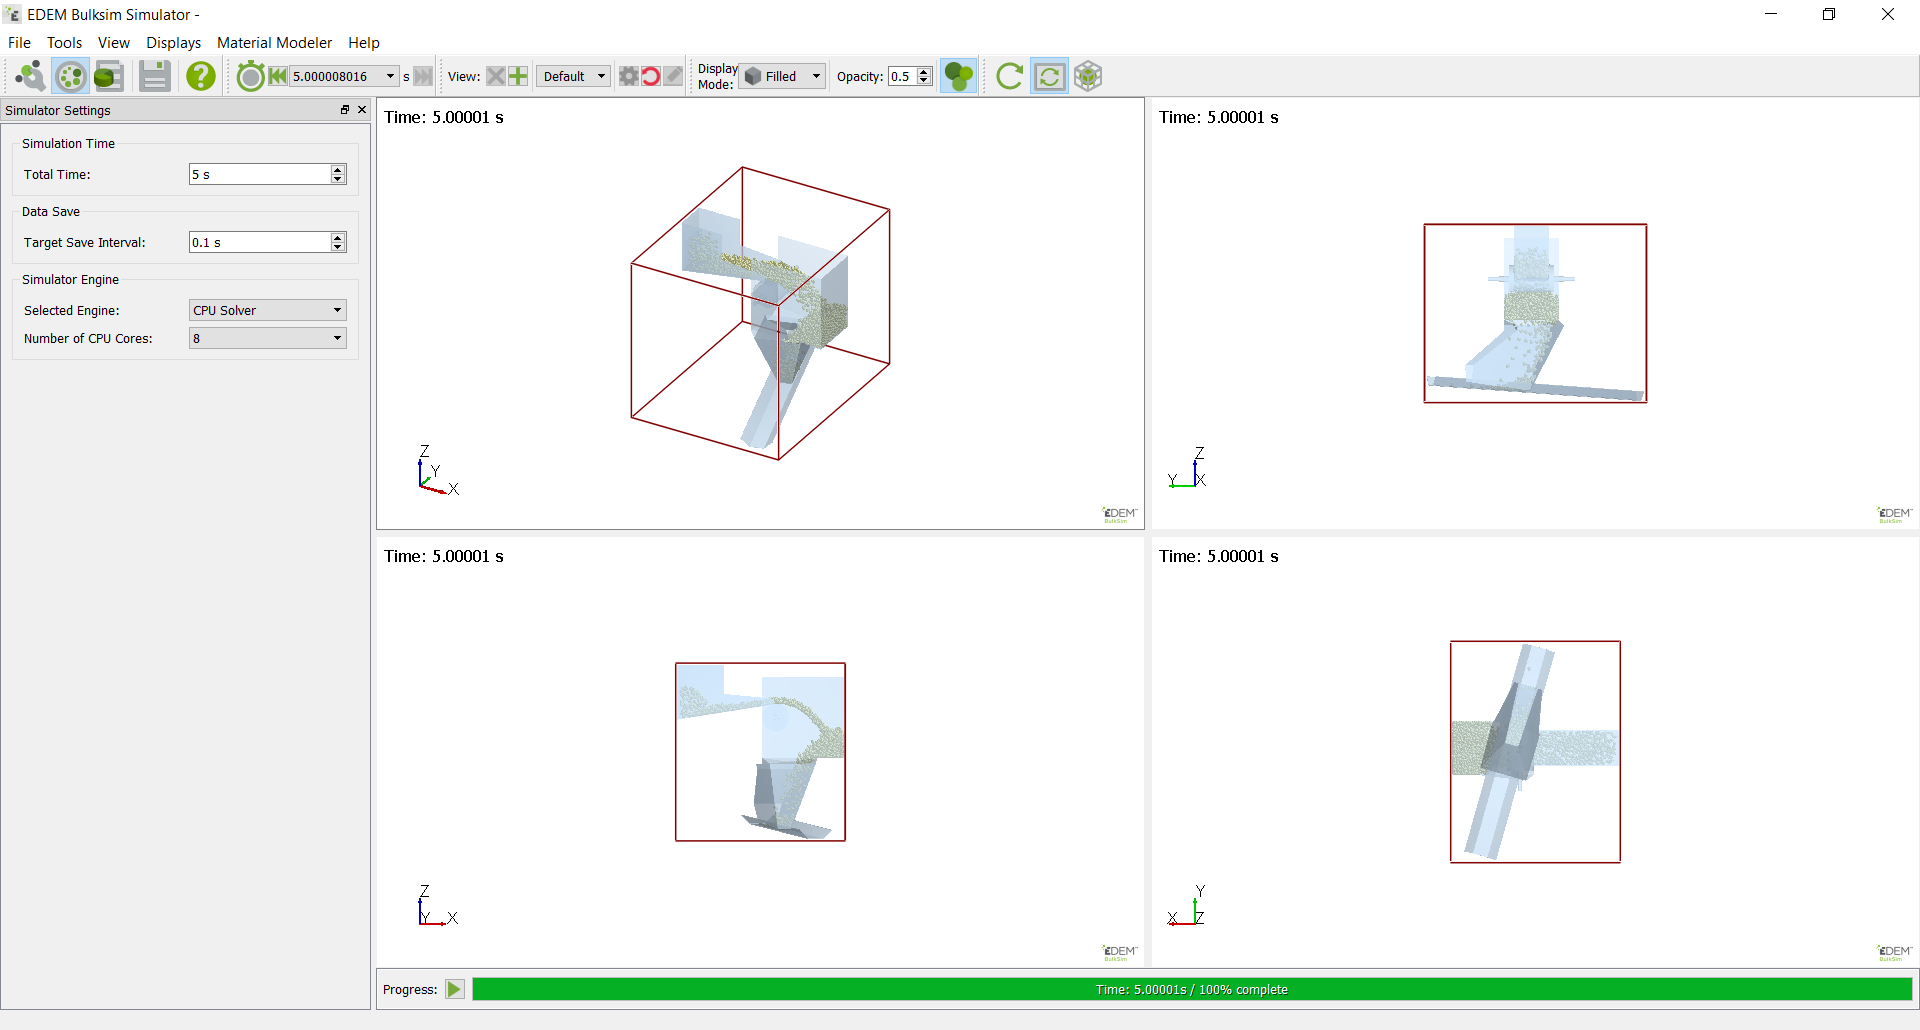
Viewer
The Viewer displays 3D representations of your particles, geometry, and fields (if applicable). The rotation, position and zoom factor of the Viewer are controlled using the mouse. You can set up more than one display splitting the screen in order to see the progress of the simulation from different points of view. The simulation start/stop button and simulation progress bar are just below the viewer.
Simulator Toolbar
| Icon | Name | Description |
|
|
Creator | Switch to the Creator |
|
|
Simulator | Switch to the Simulator |
|
|
Analyst | Switch to the Analyst |
|
|
Save | Save any changes made to Simulator settings |
|
|
Help | View the online help |
|
|
Change Time Step Back | Move to the first Time Step in the simulation |
|
|
Change Time Step Forward | Move to the last Time Step in the simulation |
|
|
Filled Display Mode | Click to display geometryfilled |
|
|
Mesh Display Mode | Click to display geometryas mesh |
|
|
Points Display Mode | Click to display geometryas points |
|
|
Display Particles | Show particles in the Viewer |
|
|
Display Frozen Particles | When checked and using the dynamic domain, any frozen particles will be colored black |
|
|
Display Cylindrical Periodic Boundary Conditions | Displays cylindrical periodic boundary conditions |
|
|
Show GPU Splitting Plane | Show/hide GPU splitting planes |
|
|
Refresh Display | Update Viewer to show the 3D simulation at the Time Step when the button is pressed |
|
|
Auto Update | Activate/Disable Auto Update |
|
|
Simulator Grid | Show/Hide Simulator Grid. (Multi-sphere only) |
|
|
Coupling Server | Start the Coupling Server |
|
|
Coupling Server | Disable the Coupling Server |


Viewer Controls
The Viewer Controls are used to determine how items are displayed in the Viewer.
- Current time
The current simulation time is displayed. Simulation can be stopped and any previous full Time Step viewed. Simulation can be restarted from any previous full Time Step. - View
Controls to change, add, and configure camera views. - Display mode
Configure the display of all the geometry in the Viewer. Select filled, mesh, or points style display. - Opacity
Set the opacity level of the geometry in the Viewer.
Simulator Menu
File Menu
- Save saves any changes made to Simulator settings.
- Import Config imports a config (*.dfg) file.
- Export Config exports a config (*.dfg) file.
- Creator switches to the Creator.
- Simulator switches to the Simulator.
- Analyst switches to the Analyst.
- Quit quits EDEM.
Tools Menu
The Tools Menu in the Simulator is the same as for the Creator with the addition of the GPU Memory Calculator.
-
GPU Memory Calculator
The GPU Memory Calculator is a tool to help estimate the memory required to run the current simulation. It also shows the memory available from the current GPU device so that you can compare estimated memory usage with available memory, if the estimated memory usage is greater than the available memory you can modify the settings below to optimize the GPU simulation memory usage.-
Total Available Memory Size
Shows the Memory available within the used GPU device, if a different GPU is used for display and processing the value available may not match the true amount available. -
Required Memory for Grid
Memory allocated to the domain grid. -
Required Memory for Particle
Memory allocated to particle data. -
Required Memory for Contact Cache
Memory allocated to the possibility of simultaneous contacts in 1 particle. -
Required Memory for Contact Storage
Memory allocated for contact data. -
Number of Particles
This value will define the amount of initial memory allocated for particles. The best option is to input the number if it is known. Otherwise, click on the green arrow to let EDEM estimate it from the factories already set in the Creator. While the default value is 100k, the minimum value can be set as 10k. -
Number of spheres (Multi-Sphere only)
This value will define the amount of initial memory allocated for contact cache and contact storage. The best option is to input the number if it is known. Otherwise, click on the green arrow to let EDEM estimate it from the factories already set in the Creator. While the default value is 100k, the minimum value can be set as 10k. -
Number of Particle – Particle Contacts
You can set it up if known. Otherwise, with the green arrow, EDEM will estimate an average of three Particle-Particle contacts per sphere. While the default value is 300k, the minimum value can be set as 10k. -
Number of Particle – Geometry Contacts
You can set it up if known. Otherwise, with the green arrow, EDEM will estimate an average of 1 Particle-Geometry contact per sphere. While the default value is 100k, the minimum value can be set as 10k. -
Required Memory for Geometry
Memory allocated to the geometry mesh. -
Total Required Memory size
Total memory required by all the points above.
-
View Menu
-
Show Particles
Activates/deactivates to see the particles in the Viewer. - Themes
Shows the EDEM interface with Legacy Theme (default) or Dark Theme. - Show Frozen Particles
When checked and using the dynamic domain, any frozen particles will be colored black. - Refresh Display
Update Viewer to show the 3D simulation at the Time Step when the button is pressed. - Auto Update
Activates/deactivates to apply Auto Update to the simulation in the Viewer. - Show Simulator Grid
Activates/deactivates to see the Simulator Grid.
Displays Menu
Splits the EDEM view window into multiple displays, allowing multiple viewer windows to review different view-points of the model within each window.
Help Menu
- Help
The help menu brings up the relevant information regarding the EDEM interface. - About EDEM
The About box provides information about the current version of EDEM. The EDEM version and revision number are useful information to provide EDEM technical support when discussing support cases. - About Altair Simulations Products
The About Altair Simulation Products gives access to the Copyright notices, Altair website, License Agreements and Customer Support.
Solve Report
The Solve Report is an .html page that displays detailed information about your model. Right click anywhere within the Solve Report and choose Save to save the information in an .html file. The solve report details information from the last refresh point, this may not be the current simulation time. Right click on the solve report and choose 'refresh' to update the information shown to the current simulation time. There are six sections in the Simulator’s Solve Report:
Simulation
-
Status indicates whether the simulation is processing or stopped.
-
Current time indicates the time elapsed into processing.
-
Time step indicates the Time Step used by the model as detailed in the Simulator.
-
Estimated total computation time indicates the estimated total time to complete the simulation.
-
Elapsed computation time indicates the time since the simulation started (excluding pauses).
- Exported simulations have the elapsed time reset to 0 on export.
Grid Cells (OpenCL/CUDA solver)
-
Status indicates either allocating grid cells or if grid cells have been initialized.
-
Side length indicates the dimensions of grid cells as specified in the Simulator.
- Created indicates the number of grid cells created.
Particles
-
Total number indicates the total number of particles in the model.
- Total removed indicates the total number of particles removed from the model: for example, particles that move beyond the domain boundaries.
- Minimum speed indicates the speed of the slowest particle in the model.
- Maximum speed indicates the speed of the fastest particle in the model.
Geometry Section
-
Speed indicates the speed of the geometry section.
- Number of particles in contact indicates the total number of particles in contact with the geometry section at the current Time Step.
Energy
-
System energy indicates the total energy in the model at the current time. It is the sum of the kinetic energy, potential energy and the energy in any contacts taking place. It should be equal to the total energy gained by creating particles plus the total energy gained by geometry movement minus the energy lost through contacts minus the energy lost by removing particles.
-
Kinetic and potential energy indicates the total kinetic and potential energy in the system.
-
Total lost by removing particles indicates the total energy lost by removing particles from the domain.
-
Total lost through contacts indicates the total energy lost by contacts between elements.
-
Total gained by creating particles indicates the total energy gained.
- Total gained by external forces indicates the total energy gained from external forces.
Factory
-
Status indicates the current factory status.
- Total particles created indicates the number of particles accepted and currently being generated.
- Total particles regenerated indicates the number of particle creation attempts, if this number is significantly larger than the total particles created then it could be an indication that the simulation is running slowly due to excessive CPU effort going towards creating particles.
- Total particles failed indicates the number of particles that could not be placed once the maximum attempts to place particle is reached.
- Total particles accepted indicates the number of particles accepted in the grid.
- Creation rate/target creation rate indicates the particle or mass creation rate as specified in the Factories pane.
- Mass created since rate change indicates the amount of mass created by the factory (when creation rate is set to target mass rate of particles).
- Actual creation rate since rate change indicates the actual creation rate (as opposed to the target creation rate) when creation rate is set to target mass rate of particles.
(c) 2023 Altair Engineering Inc. All Rights Reserved.