Analyst Tree - Display
Options in the Display Section are used to configure the display of your model in the Viewer. You can enable or disable the display of geometries, particles, contacts, bonds, or selection groups (including bins and bin groups). Also, you can color all the stated elements according to the available attributes for each of them.
Display Geometries Subsection
The Geometries subsection allows the user to modify and configure the display settings for all the Geometries in the simulation, alternatively If expanded it the details for each of the geometries in the simulation can be configured. The options include:
- Display Checkbox: Enable or disable the display of the selected section or selection.
- Display Mode: Choose between filled, mesh or point style display. The mesh option is used to display the triangular elements the section is made up of. The points option shows the vertex of each element.
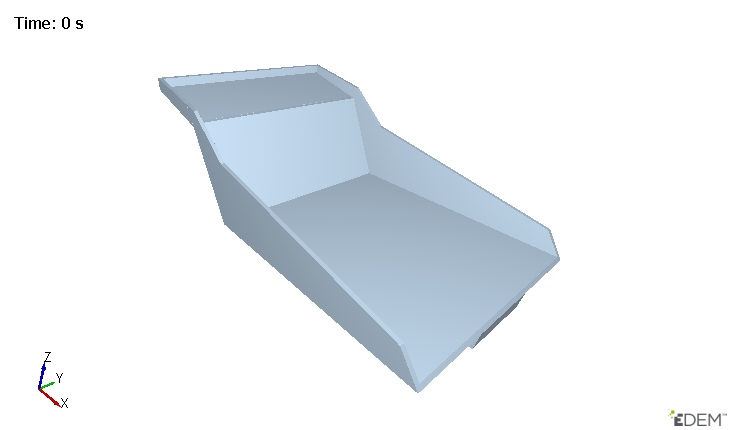
Filled Geometry:
Mesh Geometry:

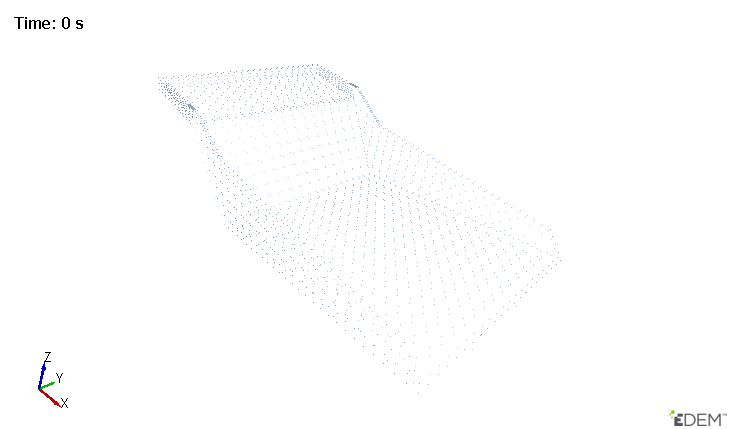
Points Geometry:
- Opacity: Set the opacity level from 0 (fully transparent) to 1 (opaque).
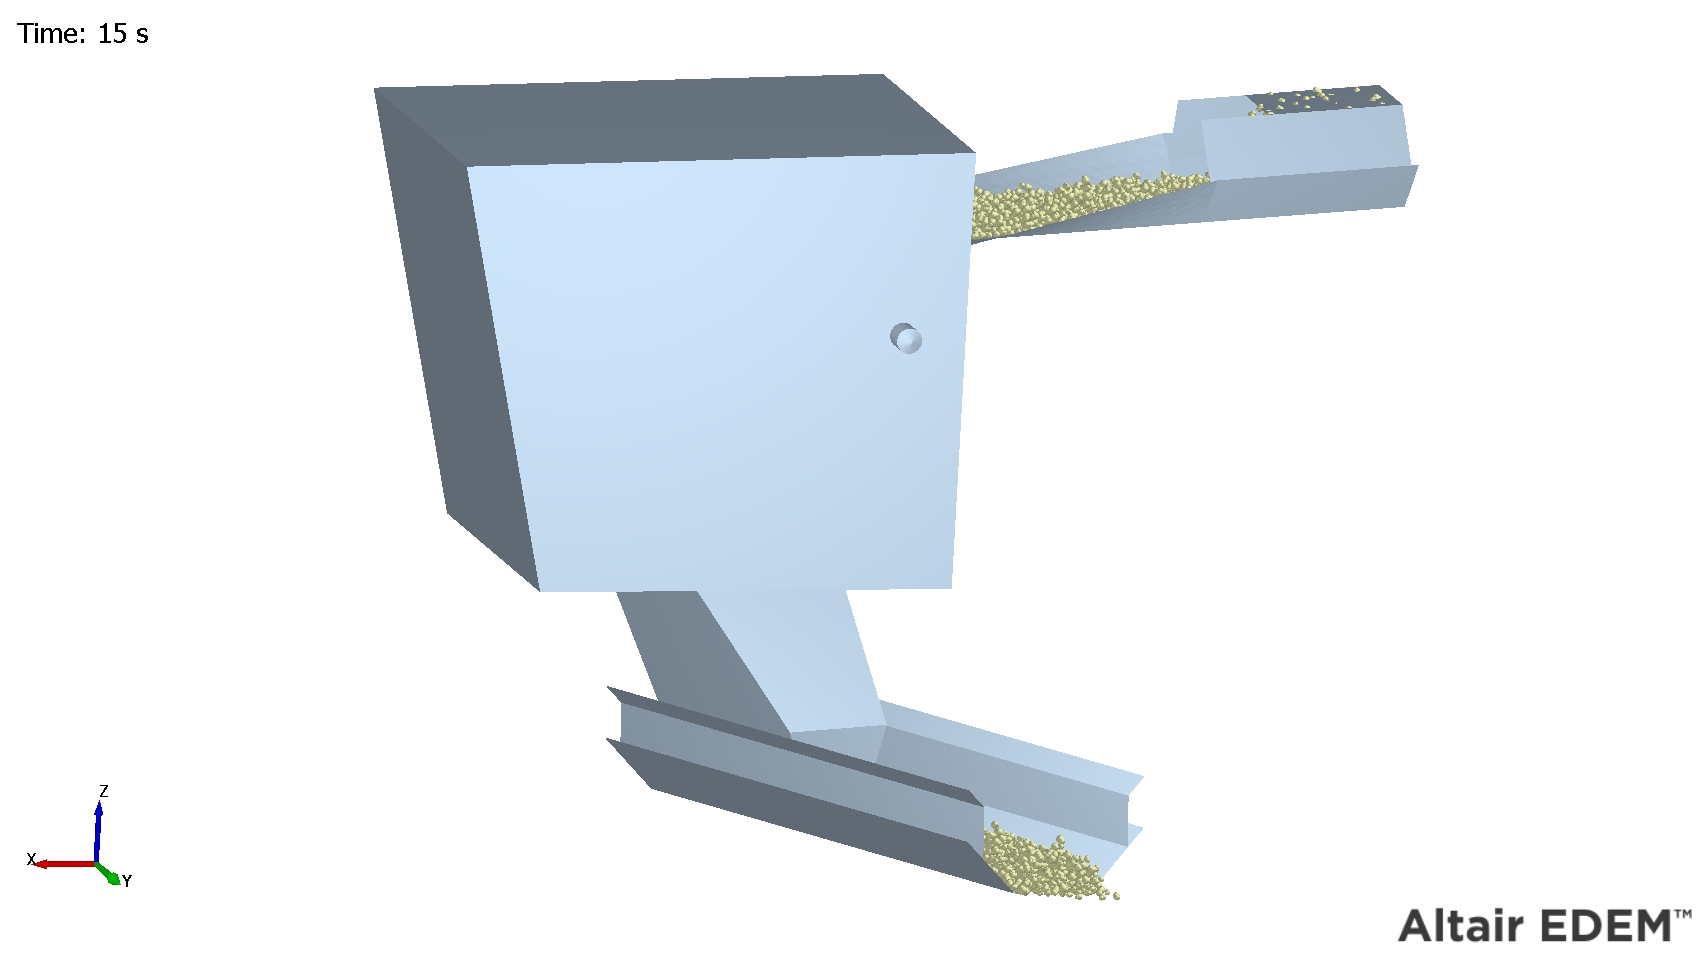
Opacity of 1:
Opacity of 0.75:
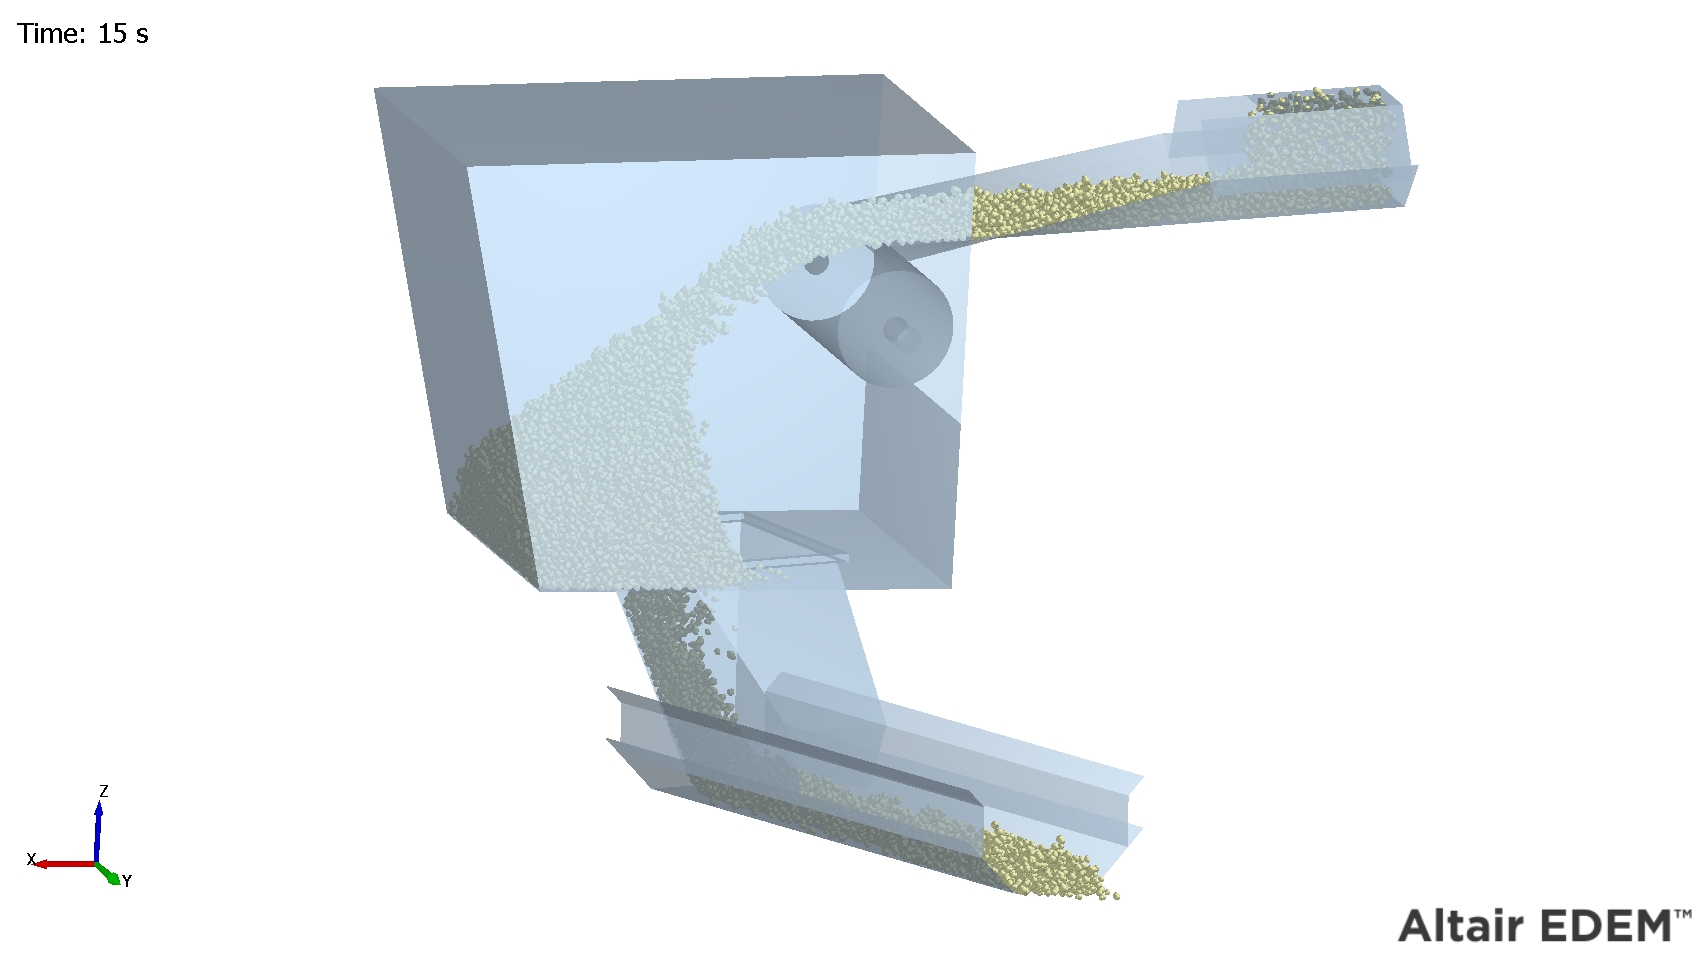
Opacity of 0.25:
-
Texture: Load in an image file (*.png, *.bmp or *.jpg) to use as a texture on geometry surfaces.
- Color By - Uniform: The selected geometry or geometries will all be colored as a whole by one color.
- Color By - Attribute: Color geometry by an attribute, this attribute is often unique to the geometry element such as its ID or current force.
| Element | Attribute | Components |
| Geometry |
Center of Mass. |
Magnitude, X, Y, Z |
|
Compressive Force. |
n/a |
|
|
ID |
n/a |
|
|
Pressure |
n/a |
|
|
Torque (element) |
Magnitude, X, Y, Z |
|
|
Total Force. |
Magnitude, X, Y, Z |
|
|
Velocity |
Magnitude, X, Y, Z |
|
| Velocity CoM | Magnitude, X, Y, Z | |
|
Custom Property. |
Depends on number of elements. |
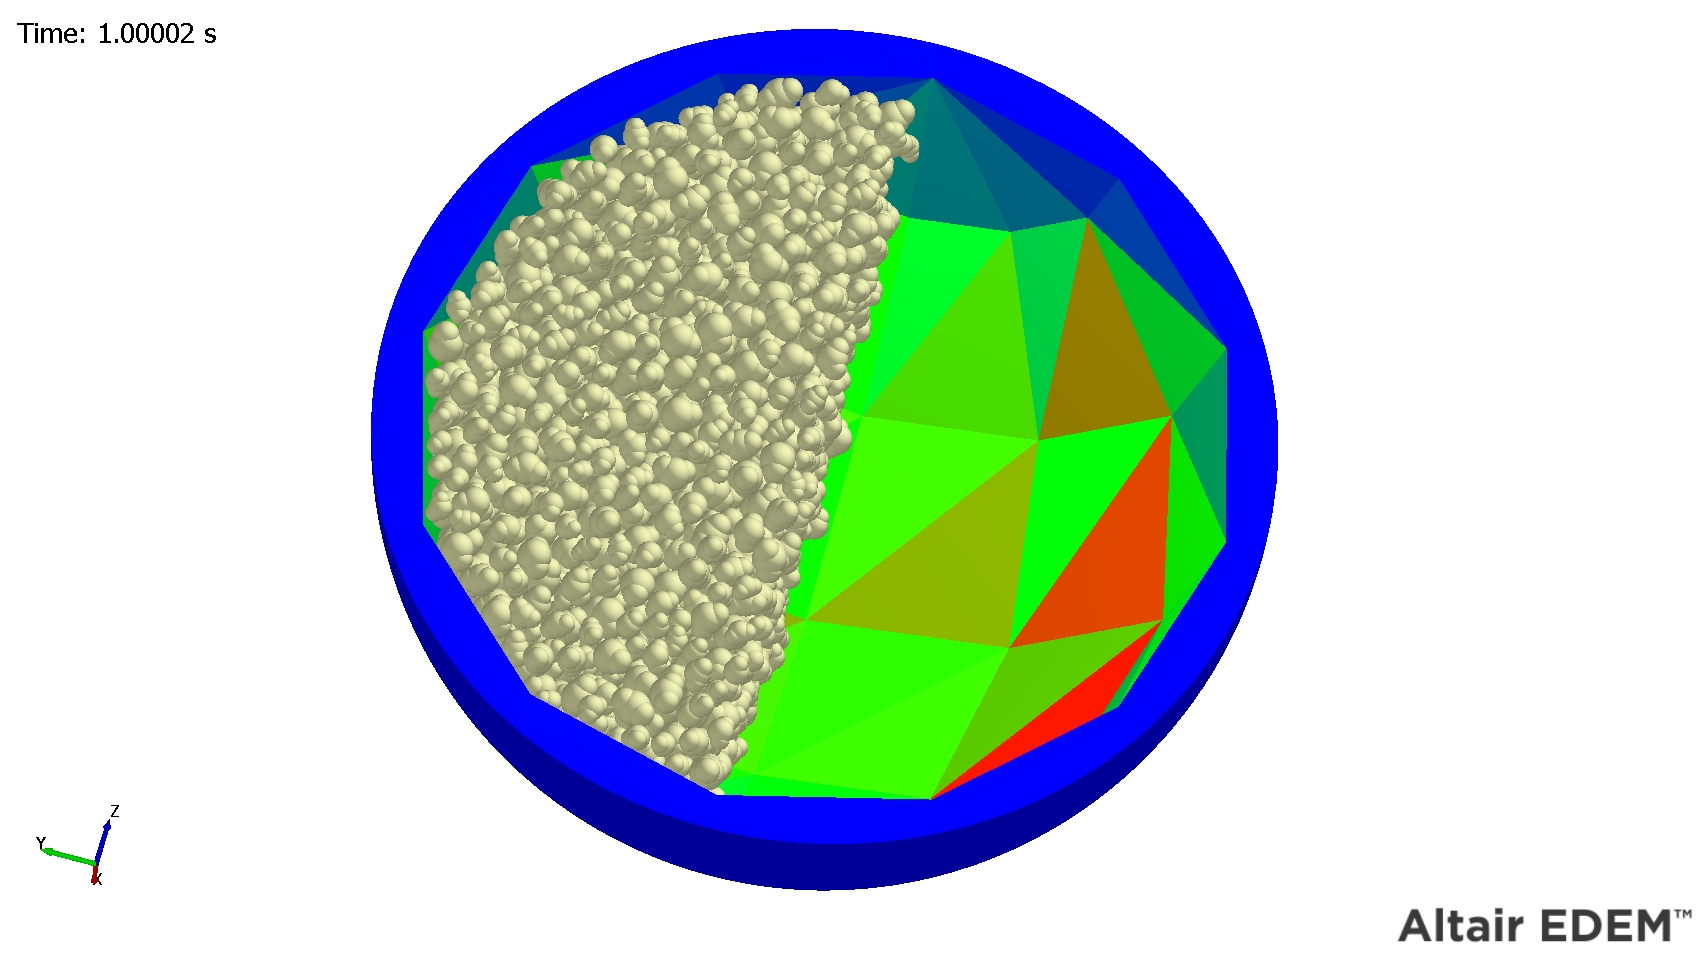
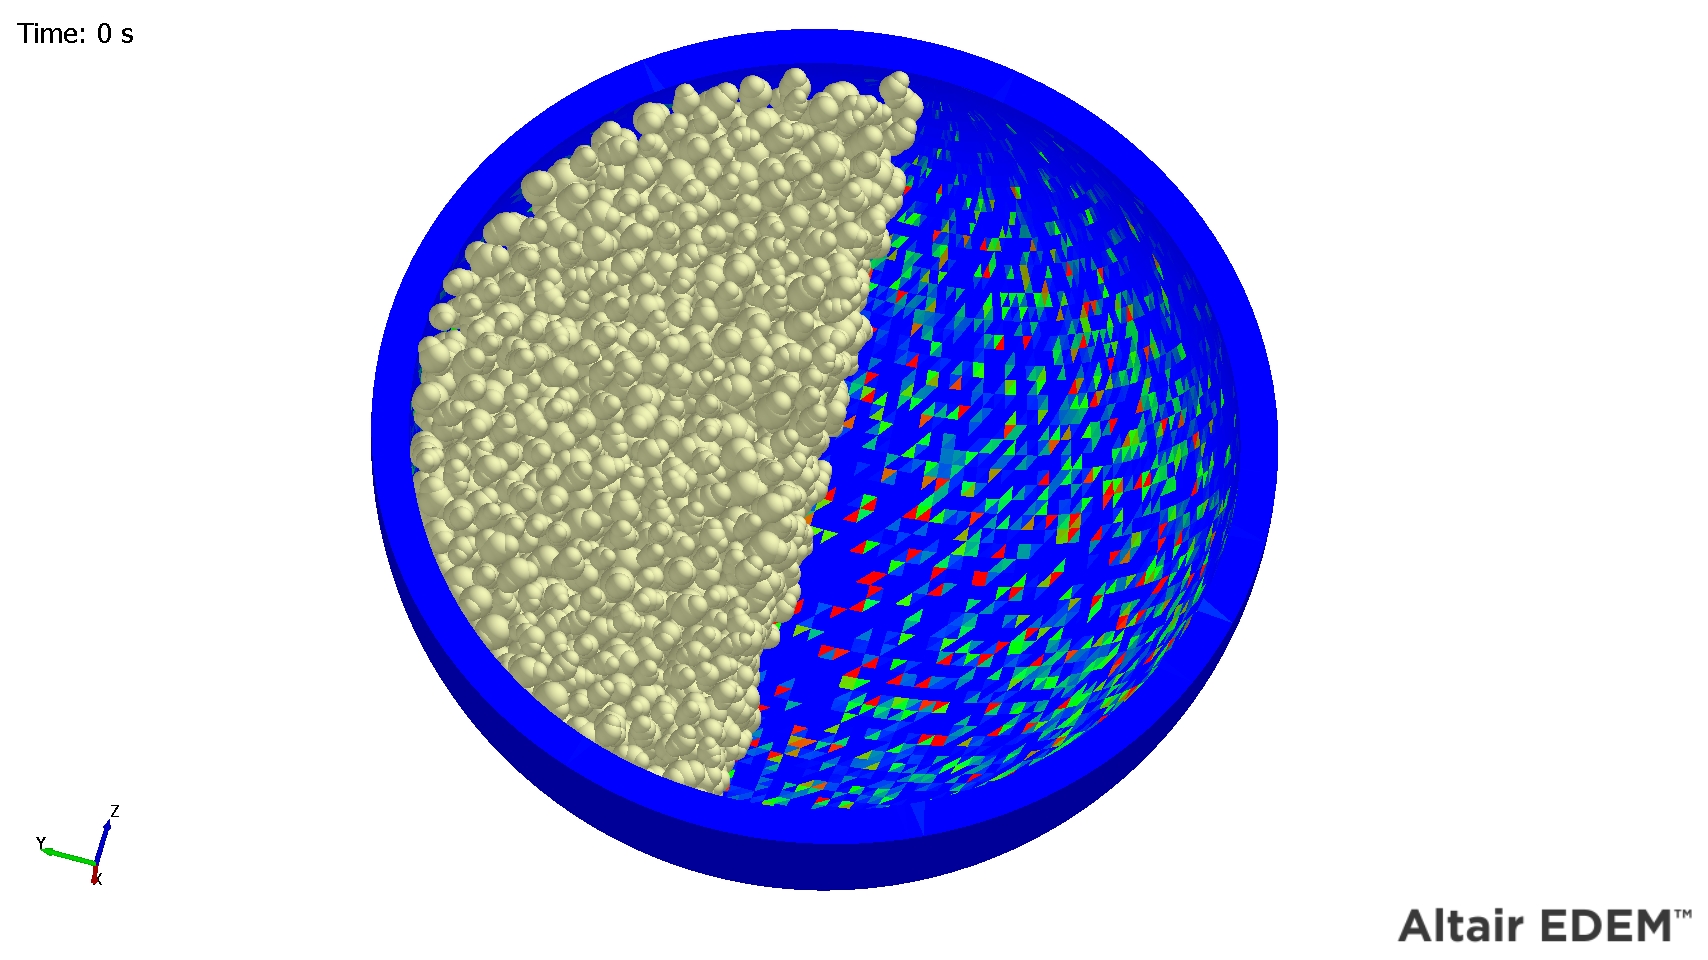
The attributes are Compressive Force, ID, Pressure, Torque, Total Force or Velocity. The torque selection is the Torque on the individual triangular geometry element based around the position of the contact point relative to the element center point. Selected geometry or geometries will all be colored based on their element attributes. The resolution of the coloring depends on the geometry Mesh resolution:
![]()
Geometry shown as few mesh triangles, the coloring is split over the the small number of triangles
![]()
Geometry shown as a large number of mesh triangles can be seen, the coloring can be shown per triangle.
- Smooth Colors
Coloring of geometry attributes can be smoothed to better visualize the color gradation. With Geometry selected from the Element pulldown, select an attribute to color by then tick Smooth Colors. Without color smoothing enabled, each geometry triangle is displayed with one color only. With smoothing enabled, the color across each triangle is interpolated based on the value of the attribute at the nodes. - Selecting Multiple Geometries.
Multiple geometries can be selected by using Ctrl + Left Mouse Click and selecting each geometry. When selected the display Mode and coloring can be modified for the selected group rather than having to modify each geometry individually.
Display Particles Subsection
The Particles subsection allows the user to modify and configure the display settings for all the Particles and Particle Types in the simulation. This can be for all particles or can be expanded to select individual particle types. The particle types refer to those defined in the Creator Tree > Bulk Material > Material > Particle section.
- Display Checkbox: Enable or disable the display of the selected particle types.
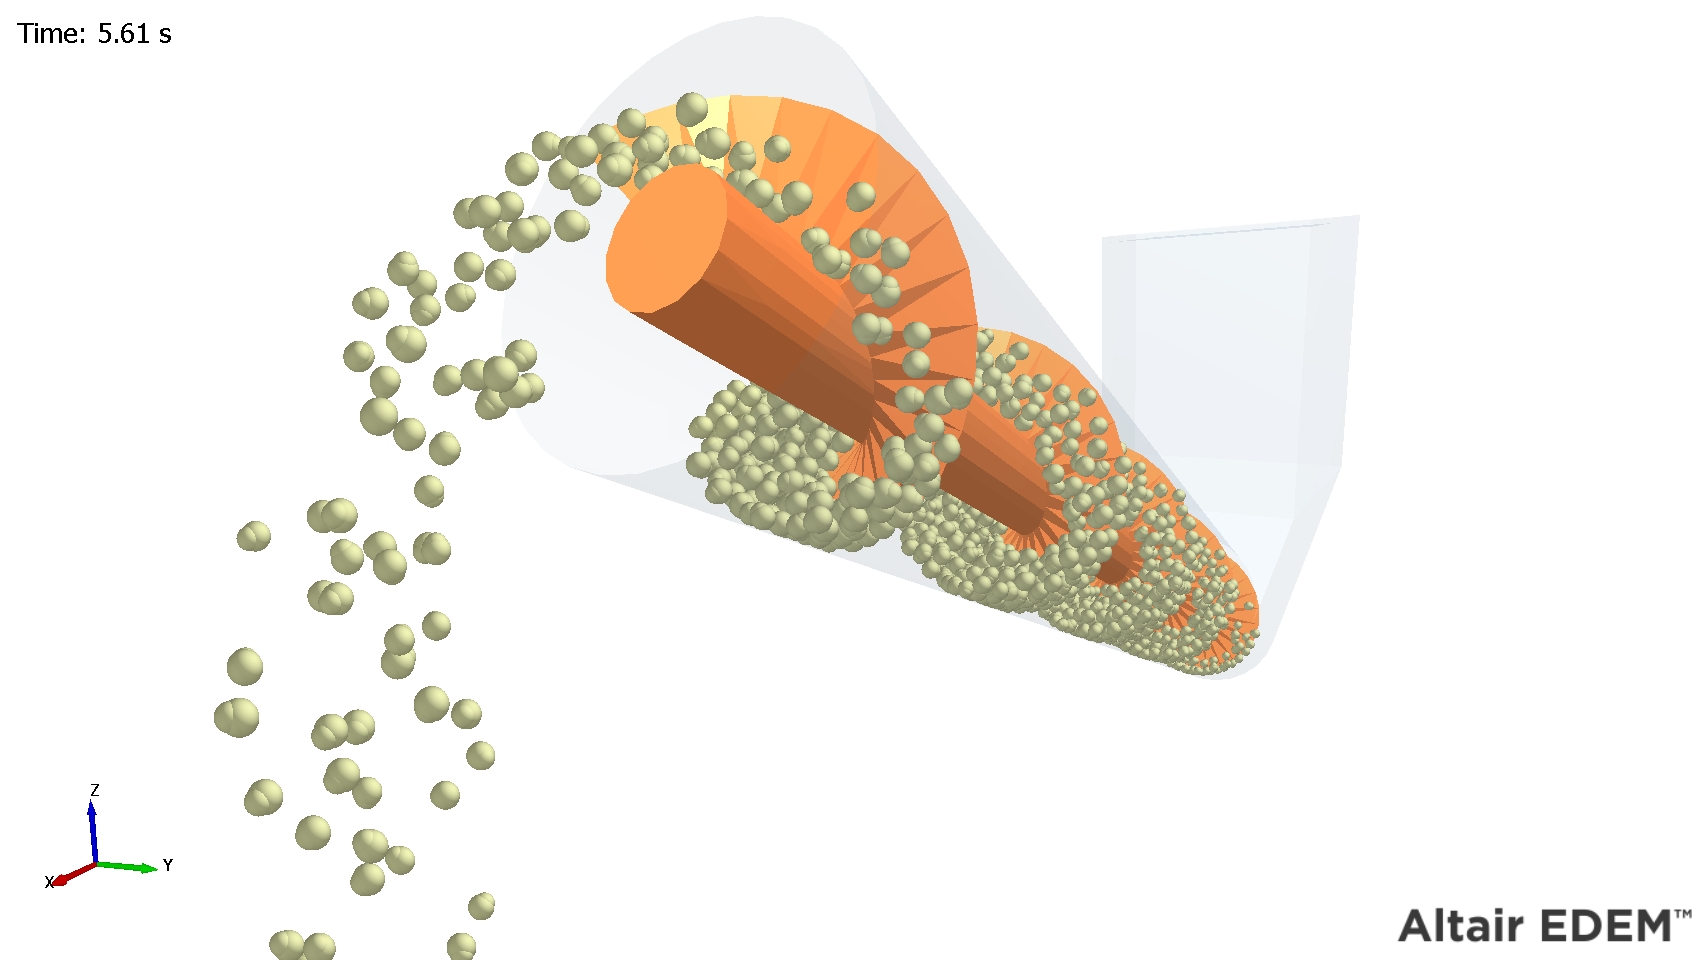
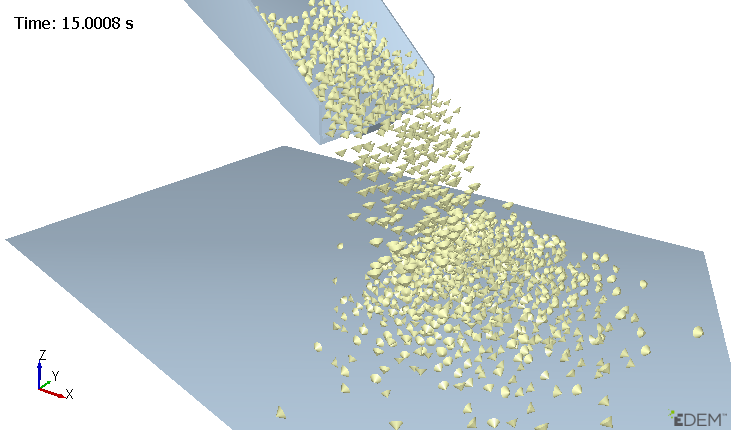
- Representation: Choose how to represent particles: either default, cone, vector, stream, or template. Click the Options button to set further display attributes.
| Option | Description |
|
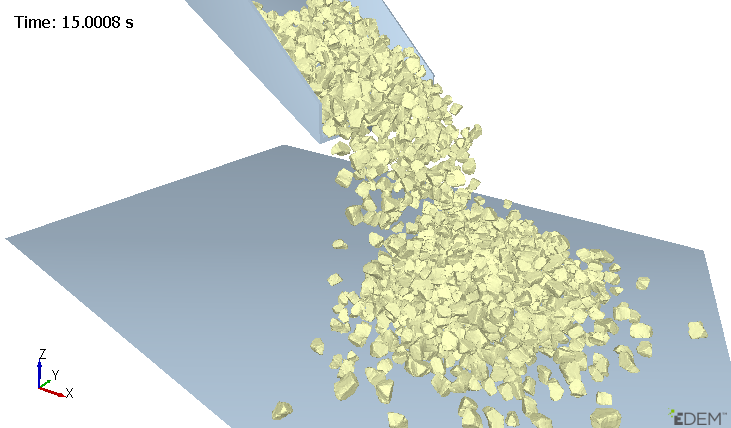
Default |
By default, particles are displayed as they were defined in the Creator.
|
|
Cone |
Particles are displayed as cones. The direction, length and base width of the cone can be set to represent a variety of particle attributes.
|
|
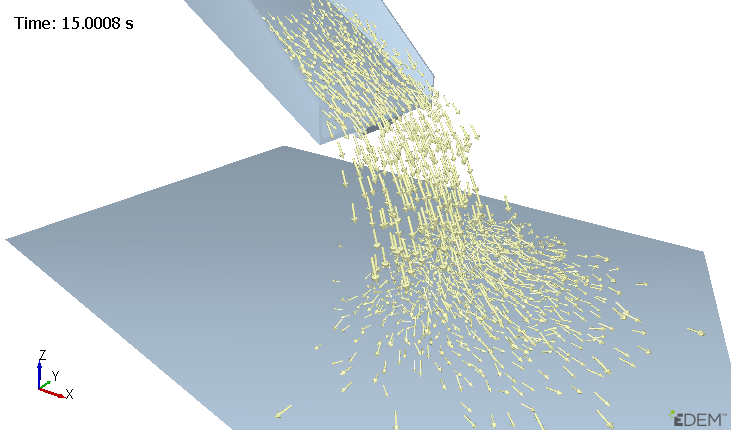
Vector |
Particles are displayed as vectors. The direction and length of the vector can be set to represent a variety of particle attributes.
|
|
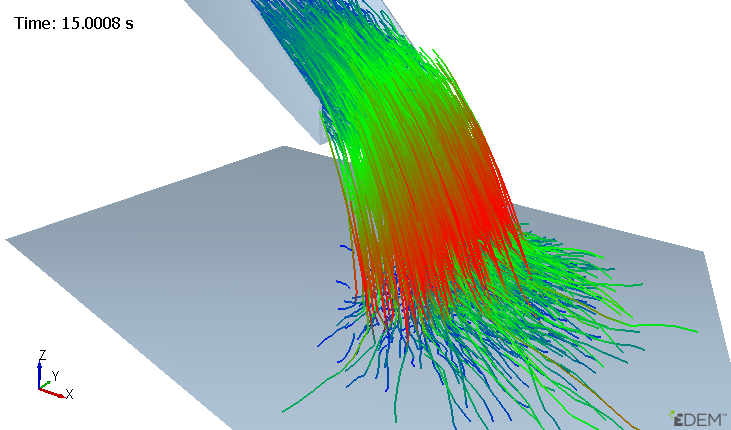
Steam |
The path of the particle is displayed as a stream with variable coloring.
|
|
Template |
Particles are displayed using one of the currently imported templates.
|
-
Texture: Load in an image file (*.png, *.bmp or *.jpg) to use as a texture on particle surfaces. Note that textures can only be loaded on to particle surfaces when the particle representation type is set to Template.
-
Opacity: Set the particle opacity level from 0 (fully transparent) to 1 (opaque). Select the Opacity check box and set the value of opacity to between 0 and 1.
Example of particles colored by Velocity with Opacity set to 0.25:
-
Color By - Uniform: The selected particle or particles will all be colored as a whole by one color.
Uniform coloring is used to set the standard color for any element. The figure on the left shows particles in three separate selection groups each colored differently using the Uniform color option.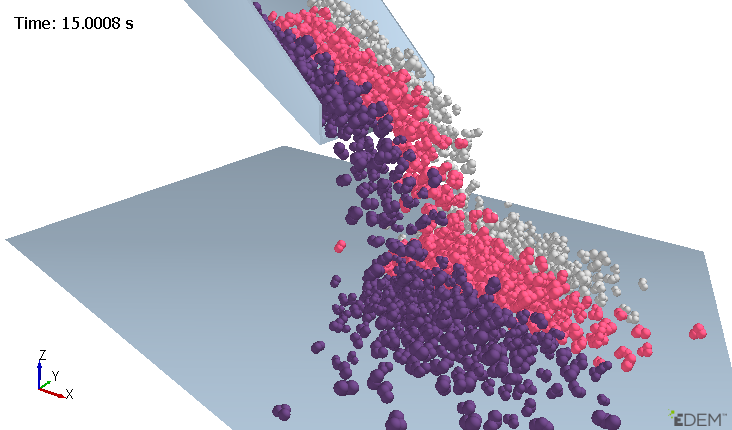
-
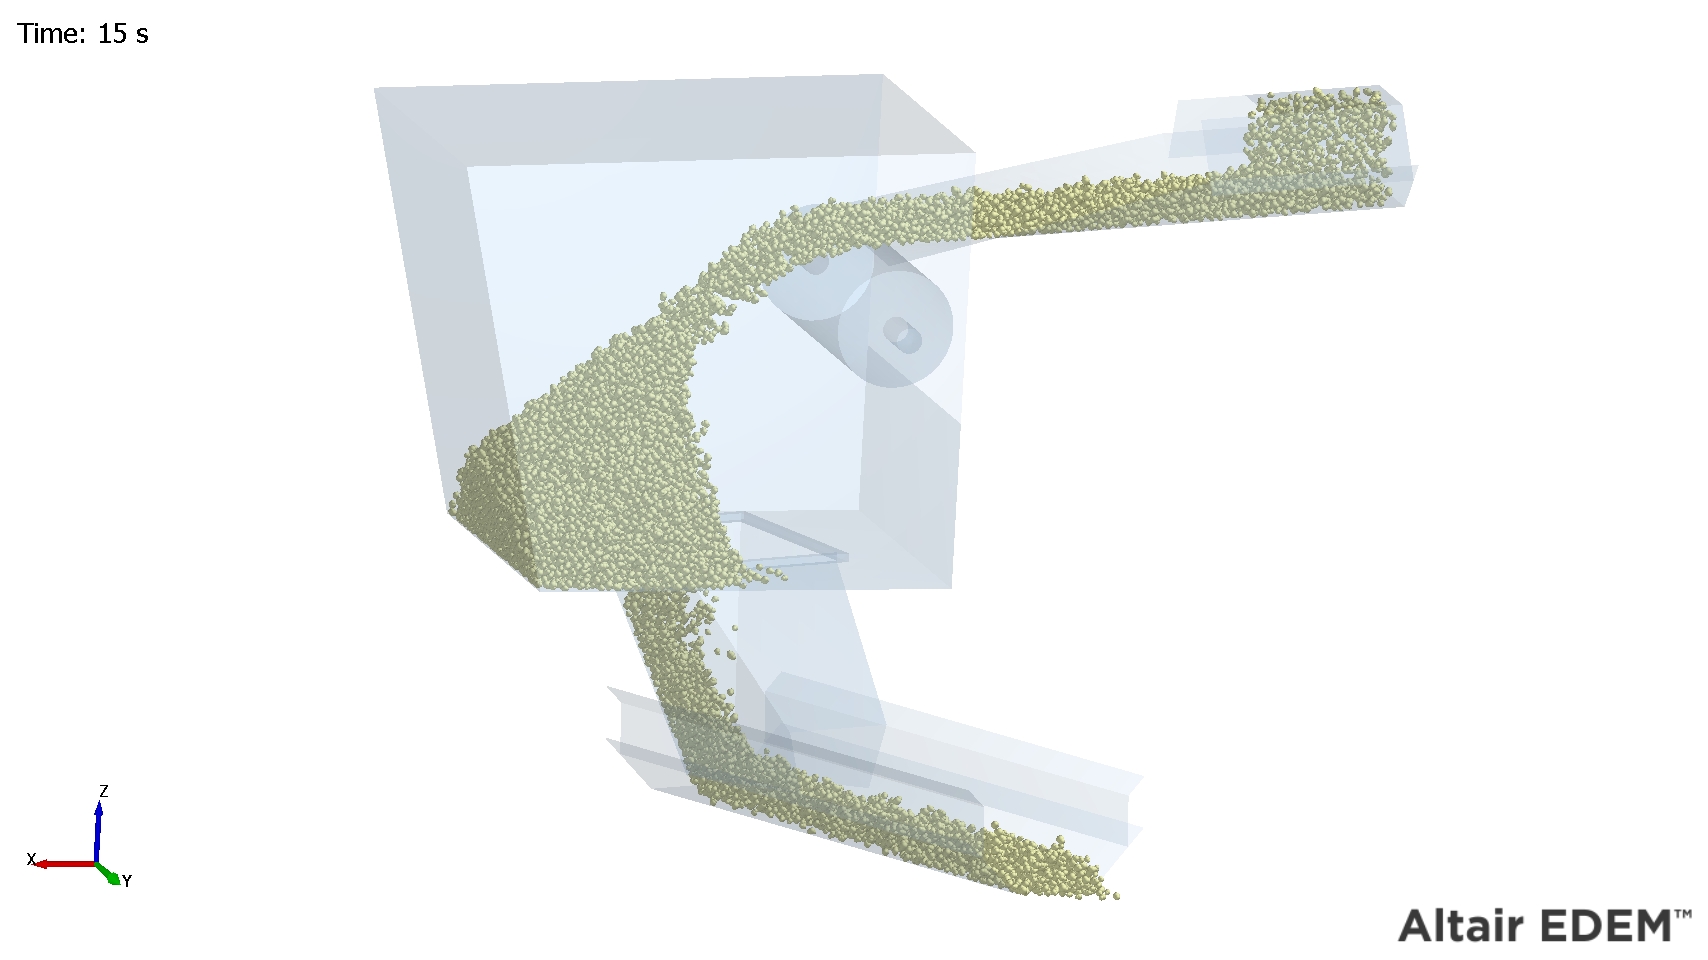
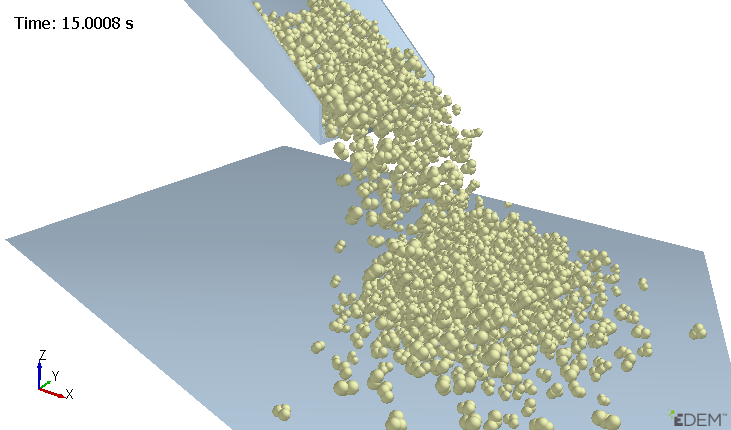
Color By - Attribute: Attribute coloring is used to color any particle of the model by a particular attribute: For example, the figure below shows all particles colored by velocity. The particles with the greatest velocity are colored red; those with the lowest colored blue.
Choose the element to color from Color By selection, then select the attribute to color by.
The attributes and their components available for each element are listed in the table below.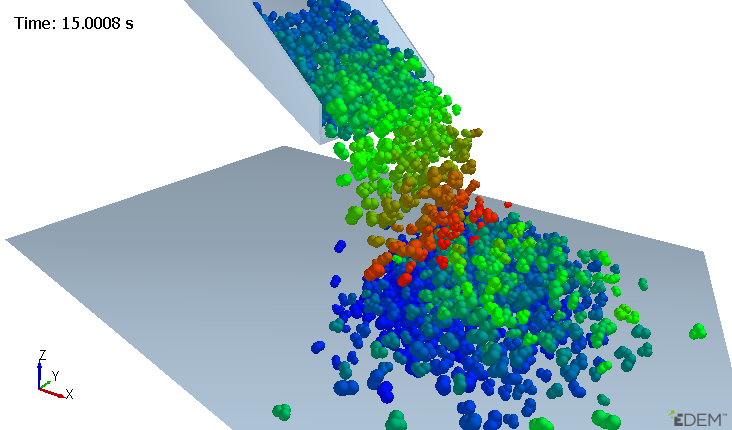
| Element | Attribute | Components |
|
Particle |
Angular Velocity. |
Magnitude, X, Y, Z |
| Axial Stress | Magnitude, X, Y, Z | |
|
Compressive Force. |
N/A |
|
|
Coordination Number. |
N/A |
|
|
Diameter (Multi-Sphere) |
N/A |
|
|
Moment of Inertia. |
Magnitude, X, Y, Z |
|
|
Kinetic Energy. |
N/A |
|
| Length. (Polyhedral) | N/A | |
|
Mass |
N/A |
|
|
Moment of Inertia. |
Magnitude, X, Y, Z |
|
|
Position |
X, Y, Z. |
|
|
Potential Energy. |
N/A |
|
|
Residence Time |
N/A |
|
|
Rotational Kinetic Energy. |
N/A |
|
| Stress Tensor | XX, XY, XZ, YX, YY, YZ, ZX, ZY, ZZ | |
|
Torque |
Magnitude, X, Y, Z |
|
|
Total Energy. |
N/A |
|
|
Total Force. |
Magnitude, X, Y, Z |
|
|
Velocity |
Magnitude, X, Y, Z |
|
|
Volume |
N/A |
|
| Von Mises | N/A | |
|
Custom Property. |
Depends on number of elements. |
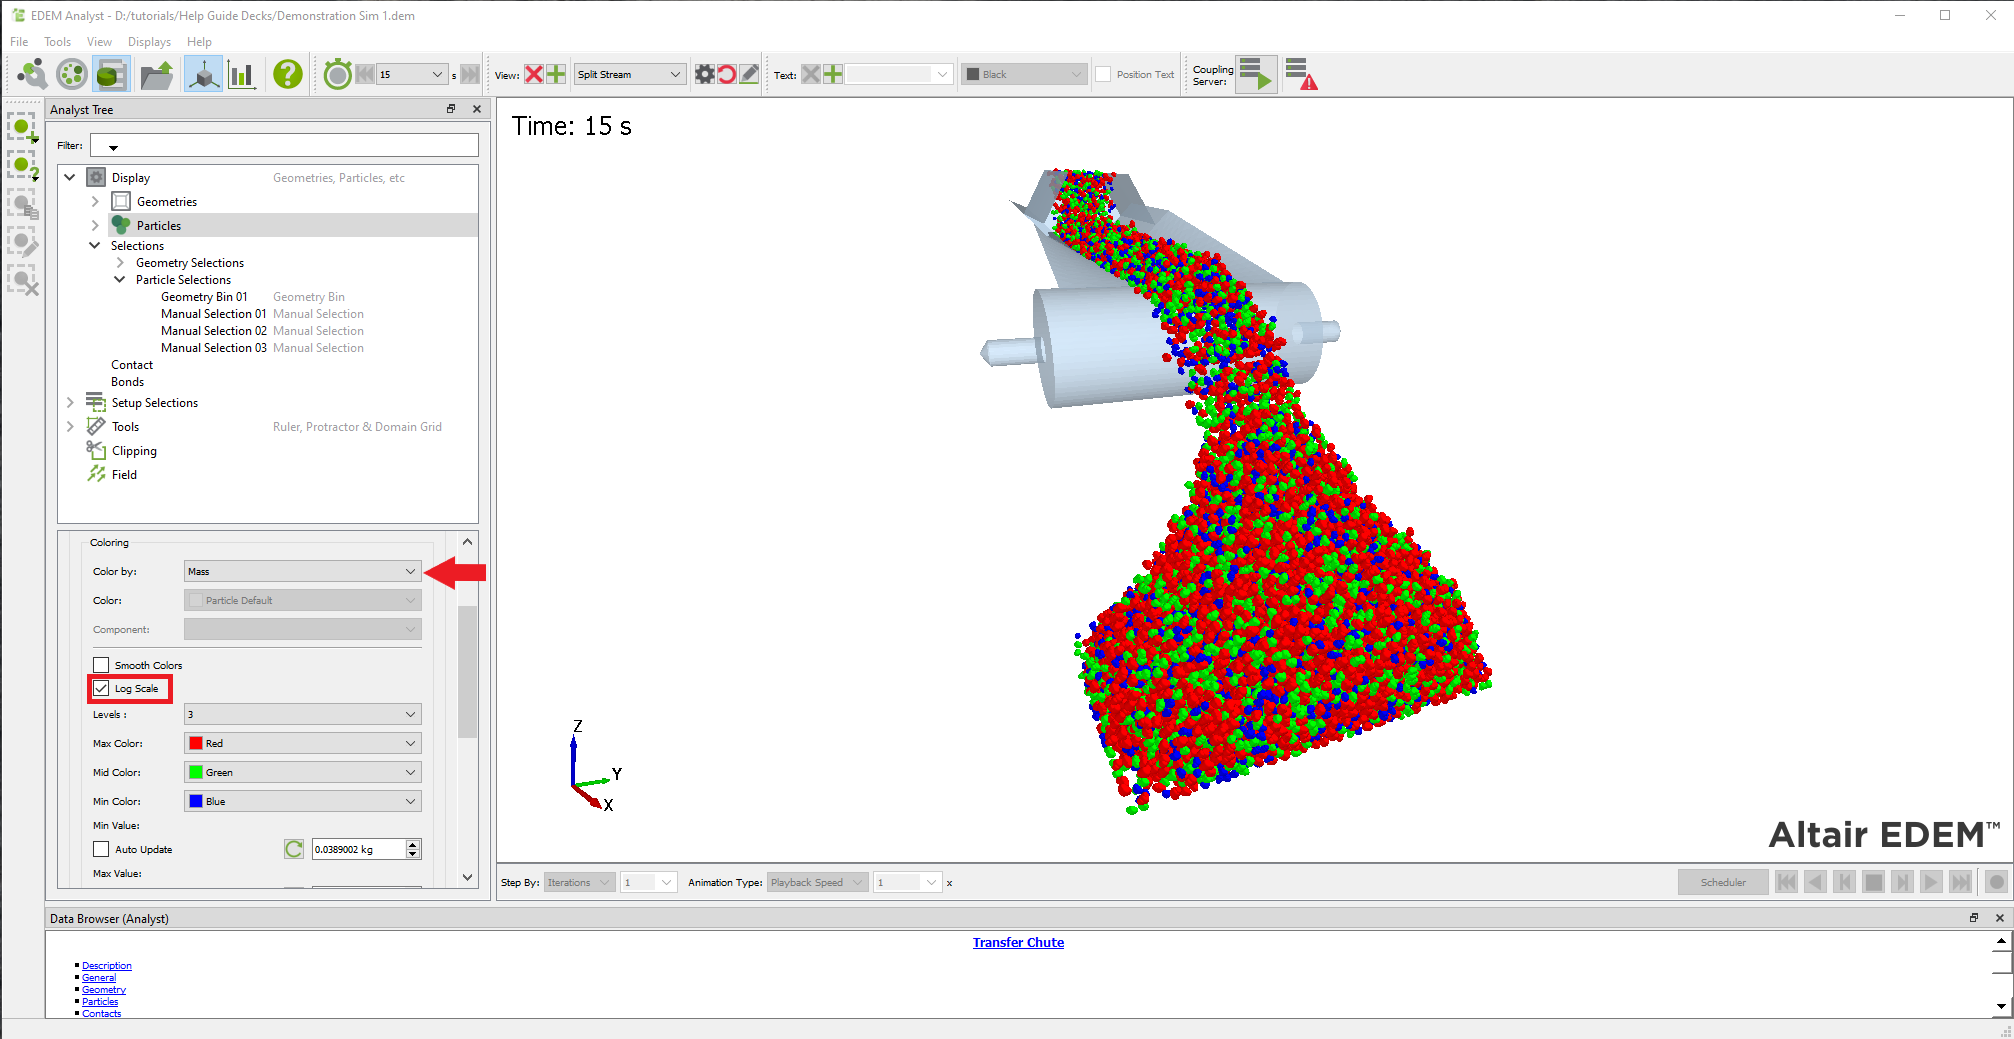
Log Scaling Coloring
Coloring of particle attributes can be scaled logarithmically for better color distribution. This feature allows you to change the coloring from linear to logarithmic and is active for particle Mass and Volume only.
With Particles selected from the Element pulldown, select an attribute to color by Mass or Volume then tick Log Scale.
Display Selections Subsection
This subsection, if expanded, shows Geometry and Particle Selections. As default no selections are available, these have to be first configured in the Analyst Tree > Setup Selections area. Once setup the following display options are available:
-
Properties by Selection Group Checkbox
For selections, enable or disable if the properties are set for each selection group. This works with the display and color by tick boxes. -
Display Checkbox
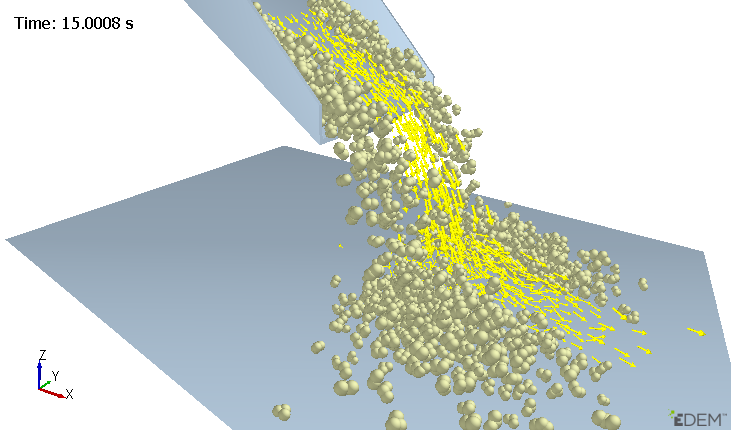
Enable or disable the display of the selection. For example if a Manual Selection of particles is highlighted (as shown below) the user can choose to display or hide this selection.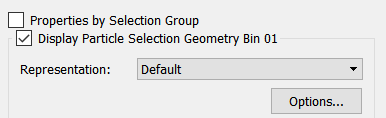
Display box checked:
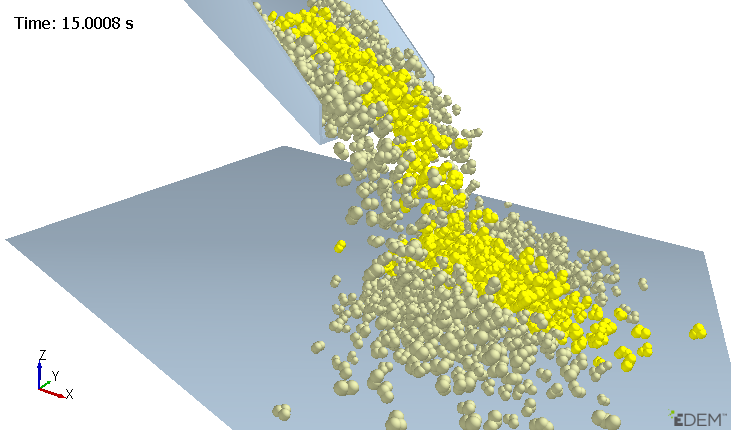
Display box not checked:
Display Mode
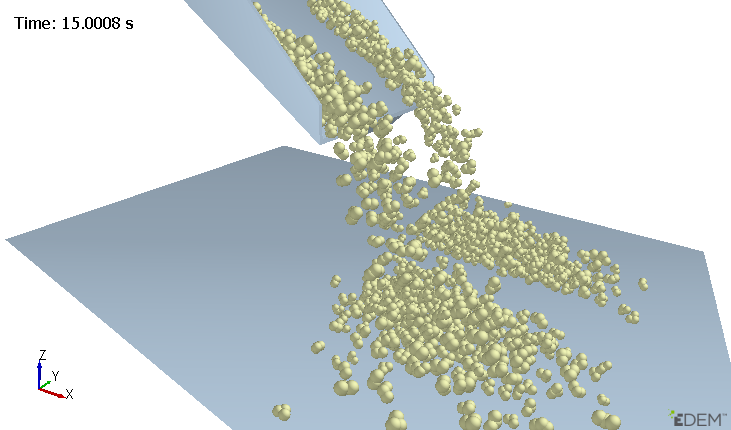
-
For equipment choose between filled, mesh or point style display. For particles choose between default, cone, vector, stream or template.
Selected group of particles displayed by Vector while remaining particles shown as default:
-
Color by Selection Group Checkbox
If enabled, you can color only the selection group following the Coloring settings.
Display Contact Subsection
Contacts between different types of particles and between particles and individual sections of geometry can all be examined independently. Use the “Particle” and “Contact with” dropdown lists to choose a pair of elements. Particles can contact with other particle types or equipment types.
-
Display Contact Checkbox
Enable the Display option to show the contacts in the Viewer. Please note that display contacts can result in slow graphics performance.
Standard particle display:
Particles not displayed and all contacts are displayed:
-
Display Contact Attribute
The display can represent the following attributes:-
Contact Vector
Displays an equal sized cylinder between all elements selected. -
Normal Force
Scales the contact vector option by the magnitude of the contact normal force. -
Normal Overlap
Represents the contact as a flat plate between the elements. -
Tangential Force
Scales the contact by the magnitude of the contact tangential force. -
Display Contact Opacity
Change the opacity of the contact display.Display Contact Coloring
-
-
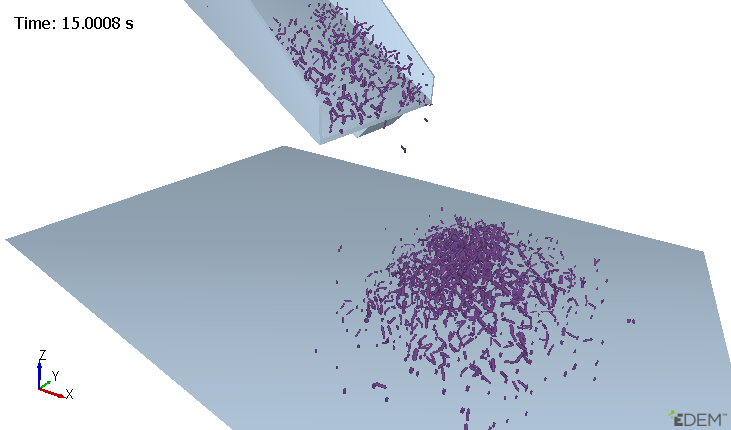
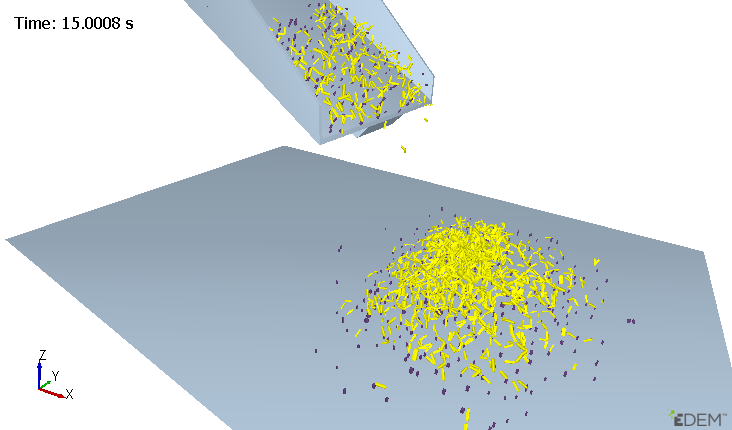
If Color by Uniform is selected the contact group or groups will be visualized by the defined color.
Particle-particle contacts colored yellow with particle-geometry contacts colored purple:
If Contact Color by Attribute is used to color any contact pair by a particular attribute, the available options are:
| Element | Attribute | Components |
| Contact | Contact Normal (Polyhedral) | Magnitude, X, Y, Z |
|
Contact Vector 1. |
Magnitude, X, Y, Z |
|
|
Contact Vector 2. |
Magnitude, X, Y, Z |
|
|
Normal Force. |
Magnitude, X, Y, Z |
|
|
Normal Overlap. |
n/a |
|
| Overlap Volume (Polyhedral) | n/a | |
| Penetration Depth (Polyhedral) | n/a | |
|
Tangential Force. |
Magnitude, X, Y, Z |
|
|
Tangential Overlap. |
n/a |
|
|
Custom Property. |
Depends on number of elements. |
Display Bonds Subsection
EDEM has two Bonded models. A legacy Bonding model and an updated Bonding V2 model.
Bonding V2 Model
Bonds are calculated through Custom Contacts. To display bond information for the V2 model this can be shown through the Analyst Tree > Display > Contact option and choose the pair of elements to display.
The following information can then be displayed (Color by) or exported:
- Bond Status – value shown is 0,1 or 2.
- 0 indicates no bond has been created
- 1 indicates an active bond is in place between the elements
- 2 indicates a bond has been broken
- NormBondForce Component 0, 1, 2
- NormBondForce Component 0 is the X component of the bond normal force.
- NormBondForce Component 1 is the Y component of the bond normal force.
- NormBondForce Component 2 is the Z component of the bond normal force.
- NormBondTorque
- NormBondTorque Component 0 is the X component of the bond normal Torque.
- NormBondTorque Component 1 is the Y component of the bond normal Torque.
- NormBondTorque Component 2 is the Z component of the bond normal Torque.
- RandomBondStiffnessValue
- A random value between -1 and +1 assigned to each bond. The bond stiffness used is the RandomBondStiffnessValue * Bond Stiffness Range * Bond Stiffness Value
- TangBondForce Component 0, 1, 2
- TangBondForce Component 0 is the X component of the bond tangential force.
- TangBondForce Component 1 is the Y component of the bond tangential force.
- TangBondForce Component 2 is the Z component of the bond tangential force.
- TangBondTorque
- TangBondTorqueComponent 0 is the X component of the bond tangential Torque.
- TangBondTorque Component 1 is the Y component of the bond tangential Torque.
- TangBondTorque Component 2 is the Z component of the bond tangential Torque.>
Bonding Model (legacy)
Bonds can be displayed through the Analyst > Display > Bonds section of the Analyst Tree.
-
Display Bonds Bond State
Select the Bond State (either Intact Bond or Broken Bond). Use the dropdown lists to choose a particle type and another particle type to bond with. -
Display Bond Checkbox
Enable the Display option to show the bonds in the Viewer. -
Display Bonds Display Attribute
For broken bonds, set the distance threshold to define the distance between the center of particles before broken bonds are no longer displayed.
The display can represent the following attributes:-
Normal Force
-
Normal Moment
-
Tangential Force
-
Tangential Moment
-
-
Display Bonds Opacity
Change the opacity of the Bond display. -
Display Bonds Coloring
If color by Uniform is chosen the selected bond group or groups will be visualized by the defined color. Attribute coloring is used to color any bond pair by a particular attribute, the available options are:
| Element | Attribute | Components |
| Bond |
Normal force |
Magnitude, X, Y, Z |
|
Normal moment |
Magnitude, X, Y, Z |
|
|
Tangential force |
Magnitude, X, Y, Z |
|
|
Tangential moment |
Magnitude, X, Y, Z |
Color by: Attributes
Within the display options Geometries, Particles, Selections, Contacts and Bonds can be colored by their individual attributes. A color can be assigned for the minimum, median and maximum values. Elements will be colored depending on whereabouts in the range they fall.
The value range is determined by setting the minimum and maximum attribute values. The values can be entered directly or can be read from the model by clicking the update buttons. This takes the current maximum and minimum values of the selected attribute from the model. If the auto-update options are selected these values will update according to which time step is being viewed.
Attribute coloring can only be viewed when the current time step is either a full save or a partial save that included the required attribute.
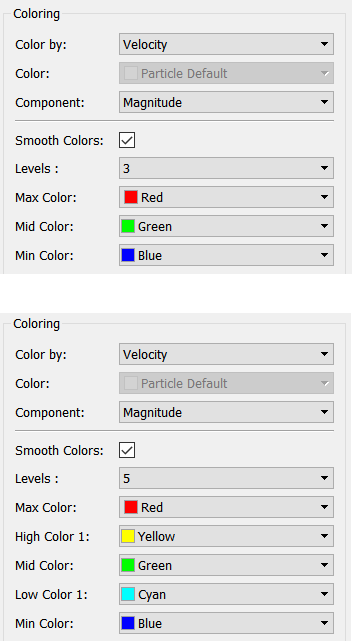
Coloring Levels
Select from the dropdown list the desired number of coloring levels to use in the attribute coloring analysis. The user will be able to customize the colors from all the levels as convenient. 3, 5, 7 and 9 color levels are available.
This enables coloring not to be set outside a min:max range, for example if using 7 color levels the minimum two colors could be set to the same value (white or light grey) and the remaining coloring set to bands to just highlight the higher values.
Min Value: Define the value of the selected attribute that is going to correspond to the color assigned for the minimum in the legend.
Max Value: Define the value of the selected attribute that is going to correspond to the color assigned for the maximum in the legend.
Auto Update: Enable the tick box to let EDEM define the minimum/maximum values depending on the calculated results.
Hide out of bounds: When Auto Update is not enabled, select this option in order to hide all the particles which value of the attribute colored is outside of the range defined by the minimum and maximum.
Coloring Legend
Enable the Show Legend option to display a color legend in the Viewer. Select the Position Legend option then click anywhere in the Viewer to position it. Click the Legend Options button to set the legend’s width, height, number of intervals, alignment and title.
Choose the ‘Hide Legends’ to remove legends for all selected elements.