Analyst Tree - Field
Options in the Field Section are used to define how fields are displayed.
Note that the Field tab is only available when you have purchased the Field Data Import Module.
Displaying and Analyzing Field Data
- Select field: Display options can be applied to each field in your model.
- Field: Select a field from the drop-down list.
- Display checkbox: Enable or disable the display of the selected field.
Field Representation
- Display mode: Choose the field display mode: Flow, Plane, or Volume.
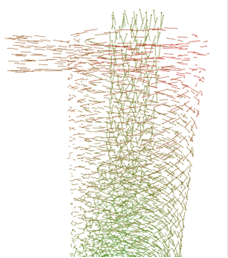
This example shows a field represented as a flow with vector display enabled:
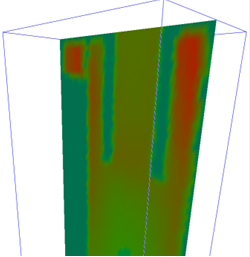
This shows the same field represented as a plane:
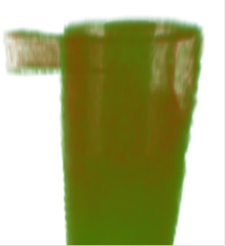
The same field again, this time represented as a volume. The opacity has been reduced to 0.1 and Hide Field options are enabled:
Flow
- Point Display – Tick to enable field points to be displayed. If enabled, set the point size. The default size is 1 pixel.
- Vector Display – Tick to enable the field to be displayed as vectors. If enabled, set the field line length.
- Set 2D Field Position – For 2D field data, set the field’s position in the Z axis (or other axis, depending on the 2D field’s orientation set in the Field Data Manager).
Plane
- Plane Orientation – Select the plane’s orientation: X-Y, X-Z, or Y-Z.
- Number of Points in X – Depending on the plane orientation, set the number of points in the X (or Y) direction from 2 to 999. Increasing the value increases the display resolution, but resampling will take longer. The default value is 100.
- Number of Points in Y – Depending on the plane orientation, set the number of points in the Y (or Z) direction from 2 to 999. Increasing the value increases the display resolution, but resampling will take longer. The default value is 100.
- Plane Position in Z – Depending on the plane orientation, adjust the position of the plane in the X, Y, or Z direction. The plane must remain within the plane’s bounding box. The default location is 0 mm.
- Resampling Method – Select the resampling method:
- Nearest Neighbor – A point-sampling method of interpolation, based on the value of the nearest point.
- Interpolation – IDW (Inverse Distance Weighting) interpolation is a multivariate method that assigns values to unknown points using values from a scattered set of known points. Nearer points are weighted higher that points that are further away.
Volume
- Number of Slices in X – Set the number of slices in the X direction from 1 to 100. Increasing the value increases the display resolution, but resampling will take longer. The default value is 10.
- Number of Slices in Y – Set the number of slices in the Y direction from 1 to 100. Increasing the value increases the display resolution, but resampling will take longer. The default value is 10.
- Number of Slices in Z – Set the number of slices in the Z direction from 1 to 100. Increasing the value increases the display resolution, but resampling will take longer. The default value is 10.
- Resampling Method – Select the resampling method:
- Nearest Neighbor – A point-sampling method of interpolation, based on the value of the nearest point.
- IDW Interpolation – IDW (Inverse Distance Weighting) interpolation is a multivariate method that assigns values to unknown points using values from a scattered set of known points. Nearer points are weighted higher that points that are further away.
Field Coloring
- Component
Select the component to color: Magnitude, X, Y, or Z. - Coloring Legend
- Width
- Height
- Value interval
- Alignment (horizontal or vertical)
- Title
- Enable the Show Legend option to display a color legend in the Viewer. Select the Position Legend option then click anywhere in the Viewer to position it. The following options can be set:
A color should also be assigned for the minimum, median and maximum values. Fields will be colored depending on whereabouts in the range they fall.
The value range is determined by setting the minimum and maximum attribute values. The values can be entered directly or can be read from the model by clicking the update buttons. This takes the current maximum and minimum values from the model.
Hide Field
- Opacity
Set the opacity level from 0 (fully transparent) to 1 (opaque). - Enable Hide
Tick to enable thresholds for the field display. When enabled, set the values to hide if less than and/or more than a certain threshold. The values can be entered directly or can be read from the model by clicking the update buttons. This takes the current maximum and minimum values from the model.