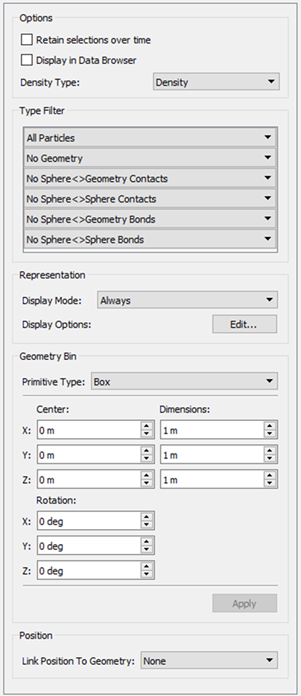
Analyst Tree - Setup Selections
Selections allow data to be extracted from a particular area or element in the domain. Using selections, you can monitor any element passing through a particular area (known as a “bin”) or track particular elements wherever they move within the domain. You can then display, color, graph, or export data based on these selections and sub-selections.
Setup selections works with Display Selections once configured.
Right clicking on the Setup Selections Section (or using  ) will allow you to add selections of the following types:
- Manual Selection

- Grid Bin Group

- Geometry Bin

- Imported Geometry Bin Group

Right clicking on a specific selection from the Tree will allow you to:
- Rename Selection

- Copy Selection

- Delete Selection

Manual Selections
A manual selection lets you select and track individual particles, contacts, geometries,
or bonds. You can then display, color, graph or export data based on these selections.
You can also define and add queries, as well as display detail in the data browser.
- From the Setup Selection Section, right click and select “Add Selection”. Then choose Manual Selection.
- Click the Enable Manual Selection checkbox. The cursor changes to a cross hair.
- Move the pointer into the Viewer.
- Single-click your selection, or press and hold the mouse button then drag the pointer to draw a selection box. All particle and geometry elements captured by the box that match the current filter will be part of the selection.
- De-select Enable Manual Selection once complete.
If an element is not displayed in the Viewer it will not be captured by the selection box. All selected elements are highlighted in orange by default. Additional selection boxes can be drawn to add further elements to the selection.
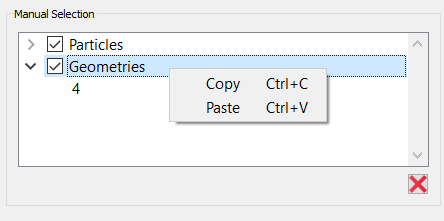
All captured elements are listed by their ID in the Manual Selection area. Click the x button to remove them completely from the selection.
If you know the specific ID it is possible to paste this into the geometry of particle sections of the manual selection box.
Select the Display in Data Browser checkbox to add information on elements in the selection to the Selection section within the Data browser.
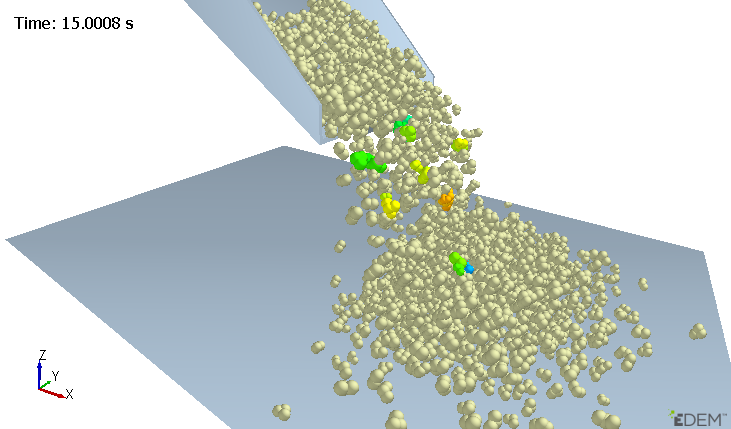
This example shows a selection group where several particles have been individually selected. Coloring has been applied to show Velocity:
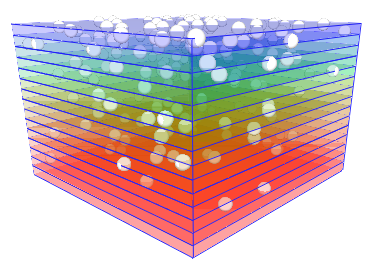
Example where material has been selected in bands, each band colored differently to show the cut-depth of the material:
Grid Bin Groups
A Grid Bin Group splits the model domain into a lattice. Each grid is known as a bin group and each cell is known as a bin. Anything in or moving through each bin can be monitored.
To create a Grid Bin Group, from the Setup Selections Section right click and select “Add Selection” then choose Grid Bin Group. Define the selection then click the Apply button to apply settings and display the group in the Viewer.
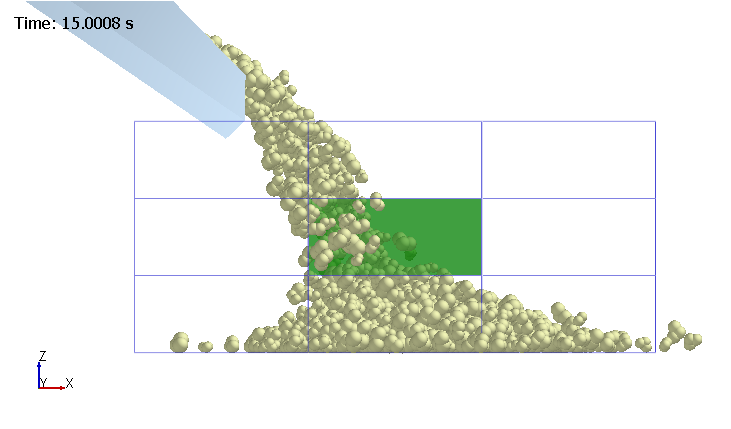
A Grid Bin Group with a highlighted bin at the center:
By default the bin group covers the entire domain; however, it can be limited to a specific area using the start and end point options:
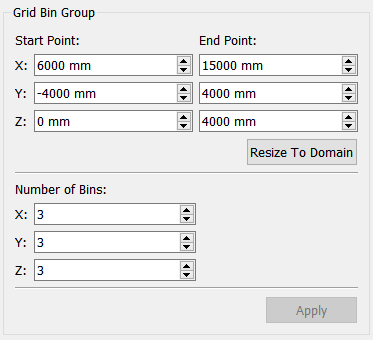
The number of bins in the group is determined by the number of bins along each axis.
Empty bins (those containing no elements) can also be removed using the Display Mode drop-down box:
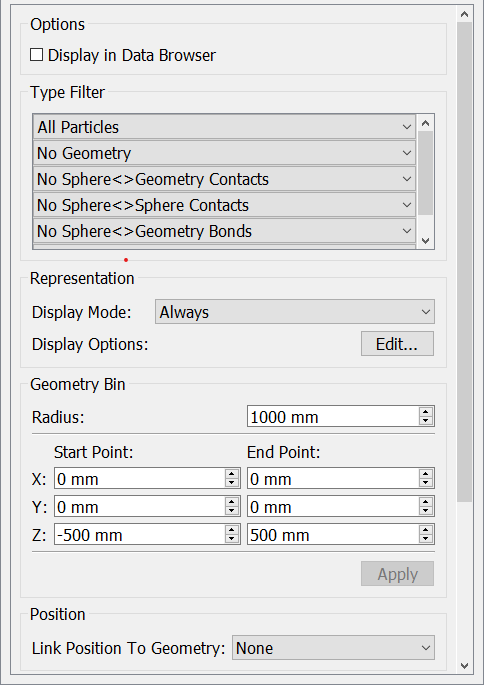
Geometry Bins
A geometry bin is a bin element based on a Box or Cylinder geometry type. You can link its position to any static or dynamic geometry section. The bin is displayed as a mesh of blue lines.
To define a geometry bin:
-
From the Analyst Tree, right click on the Setup Selections Section and click on “Add Selection”.
-
Then choose Geometry Bin.
-
Select the geometry type: either Box or Cylinder.
-
Set the bin’s properties to define its size, shape, and initial position. For cylinders, set the number of sides to determine how many polygons are used to render the bin. Fewer polygons are faster to process, but at the expense of accuracy.
-
Set the filter options to determine what to include in the bin. By default all particles are included.
-
Select the display mode and on-screen query options. For example, set the display mode so that the bin is displayed only when it contains particles.
-
Select whether to link the bin’s position to a geometry element defined in the Creator. This links to the center (or zero-point) of the geometry. If the geometry has dynamics, the bin will move along with it.
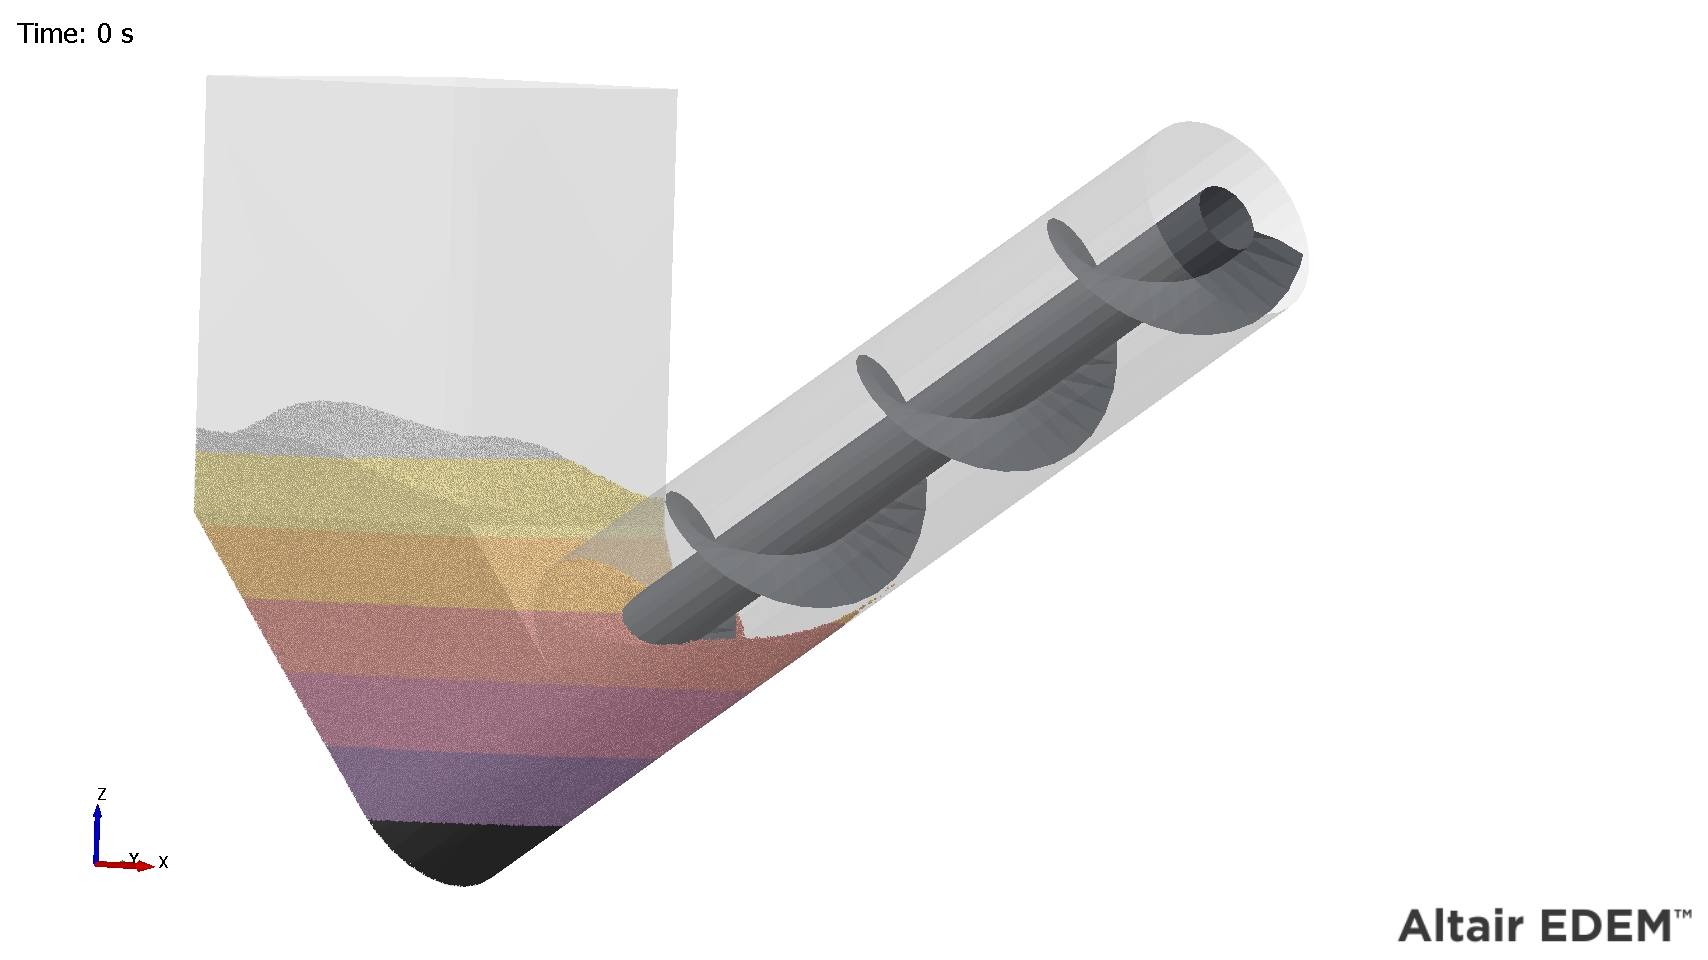
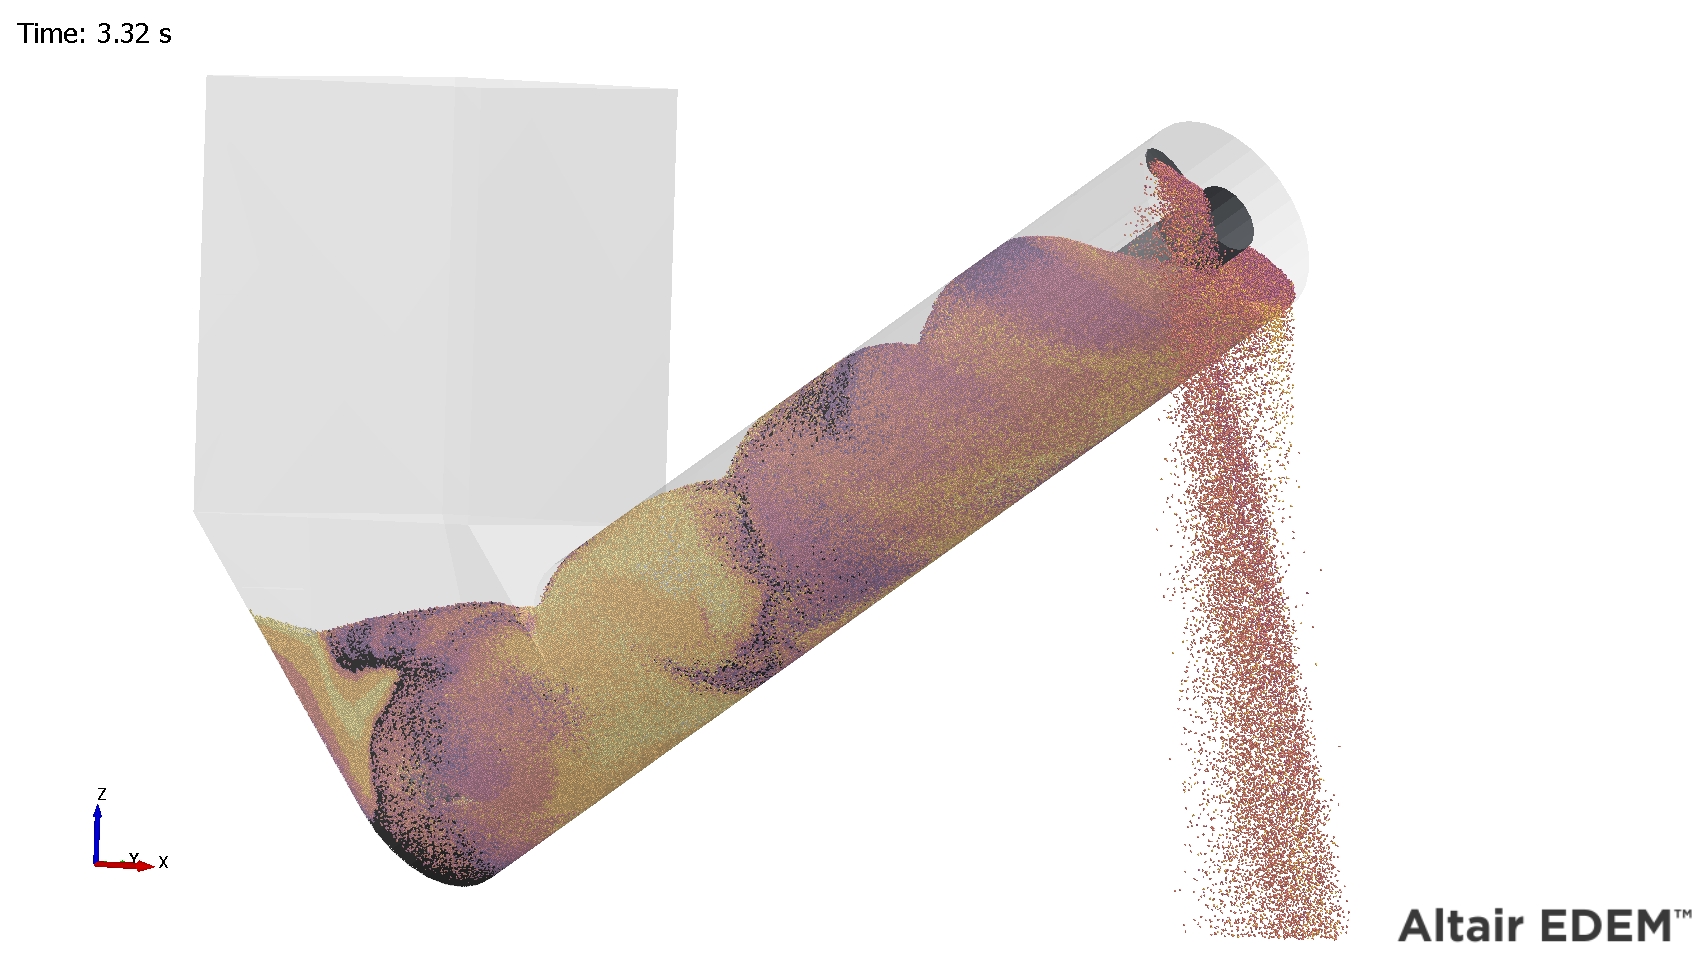
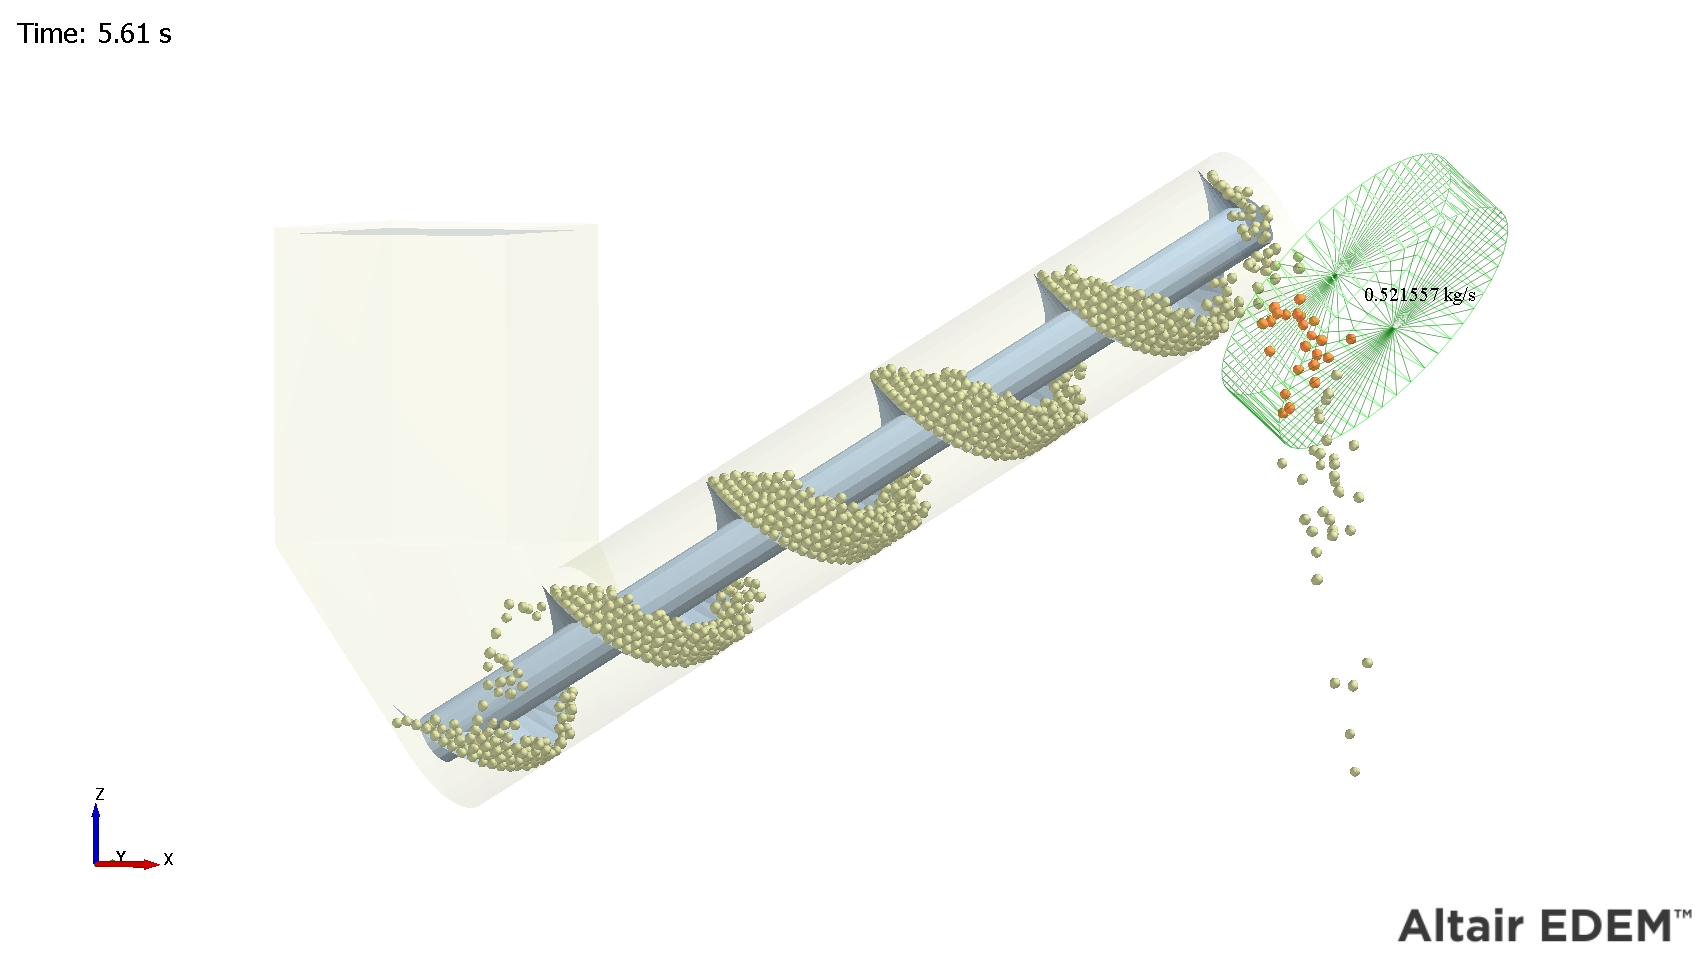
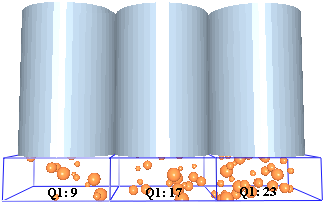
This example shows a geometry bin based on a cylinder. The bin indicates the mass flow rate and moves with the geometry section it’s linked to:
Imported Geometry Bin Group
With the imported geometry bin group you can define a bin group based on an imported mesh file or CAD template created in another package. You can then link the bin group’s position to any defined geometry.
To define an imported geometry bin group:
-
From the Analyst Tree, right click on the Setup Selections Section and click on “Add Selection”.
-
Then choose Imported Geometry Bin Group.
-
In the CAD Template Selection section, click the Import button then navigate to a CAD template file. When prompted, set the units then tick the Merge Sections option to set the template as one bin, or leave it un-ticked to create one bin for each geometry element. The imported file must contain only solid geometry elements: you cannot import surfaces (non-closed elements such as a plane).
-
Set the filter options to determine what to include in the bin. By default all particles are included.
-
Select the display mode and on-screen query options. For example, set the display mode so that the bin is displayed only when it contains particles.
-
Select whether to link the bin’s position to a geometry element defined in the Creator. If the geometry is dynamic, the bin will move along with it.
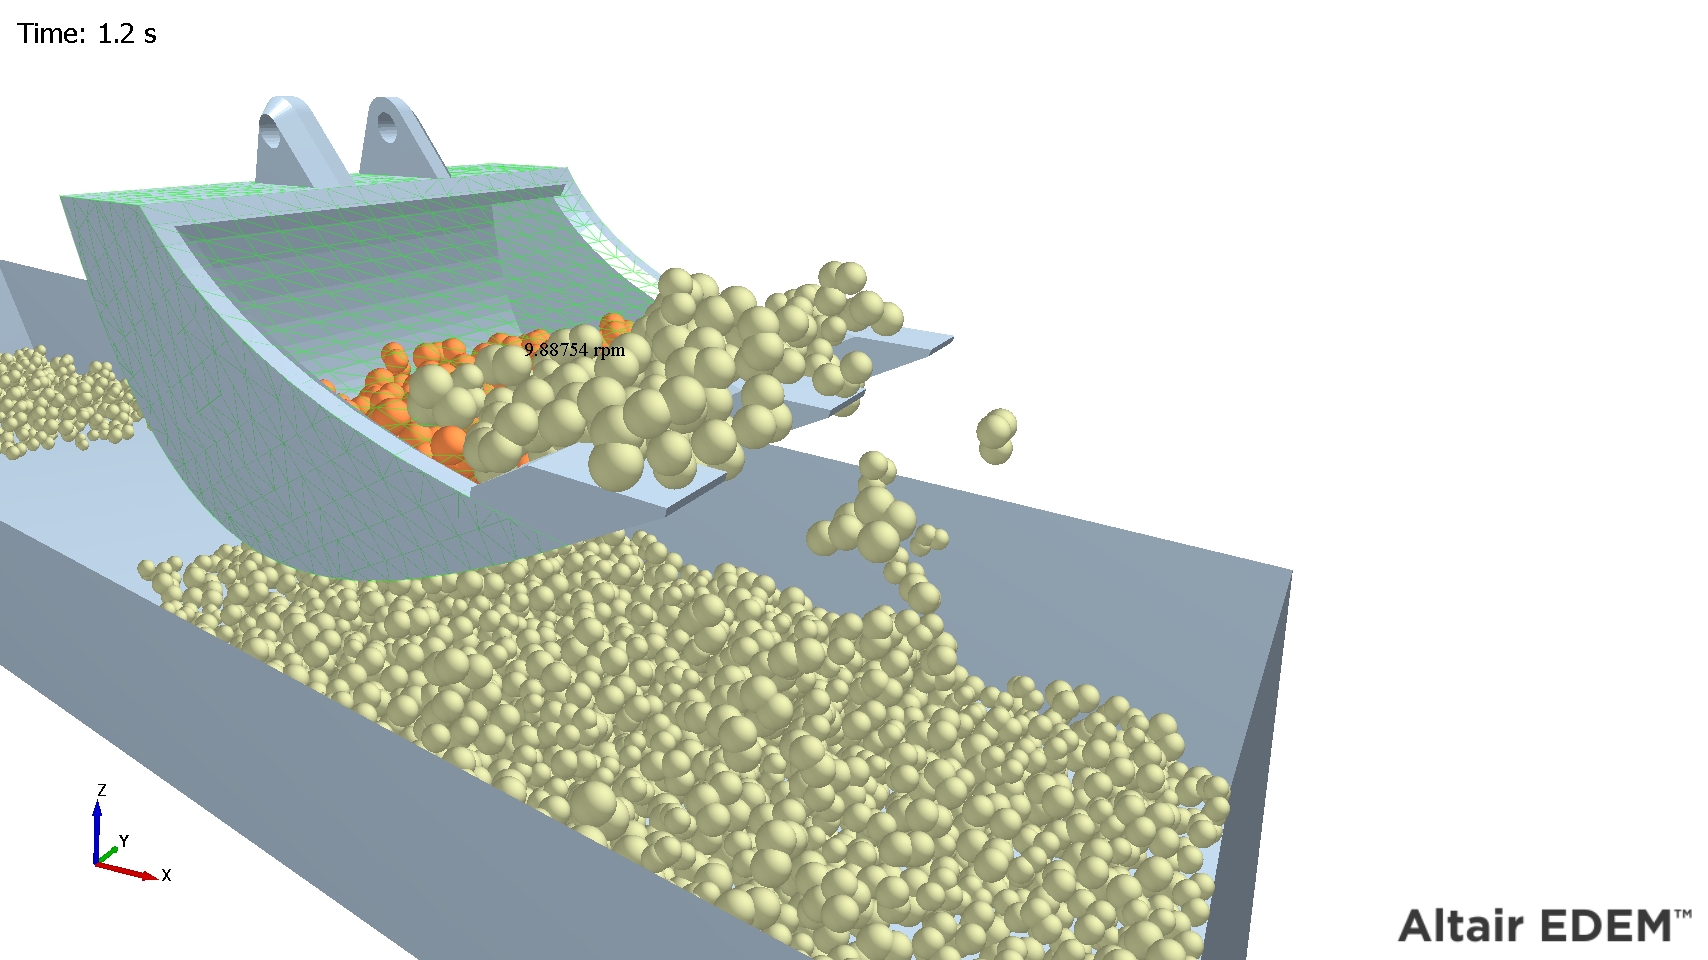
This example shows an imported geometry bin linked to a moving bucket geometry. A query has been added to display the average particle angular velocity:
Mass Flow Sensor
Mass flow rate is the rate at which particles pass through a bin group. It is measured in mass over time, for example, tons per hour or kilograms per second. Mass flow analysis enables the calculation of the rate of mass flow in a certain volume within the simulation. The user creates the volume (a cylinder) and places it within the model domain.
The calculation for mass flow rate for a single time step is
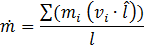
Where:
 = Magnitude of the mass flow rate.
 = The mass of particle i the selection bin.
 = The velocity of particle i in the selection bin as a vector.
 = The length of the cylinder as a unit vector.
For each particle its mass is multiplied by the dot product of its velocity and the unit vector of the cylinder from start to end. Each of these per particle values are then summed and divided by the length of the bin. The length of the bin is the distance from the start point to the end point of the cylinder.
To define the mass flow:
-
From the Analyst Tree, right click on the Setup Selections Section and click on “Add Selection”.
-
Then choose Mass Flow Sensor.
-
Set the mass flow sensor’s properties to define its size, shape, and initial position. For cylinders, set the number of sides to determine how many polygons are used to approximate the circumference of the cylinder. Fewer polygons are faster to process, but at the expense of accuracy.
-
Set the filter options to determine what to include in the calculation of the mass in the bin. By default all particles are included.
-
Select the display mode and on-screen query options. For example, set the display mode so that the bin is displayed only when it contains particles.
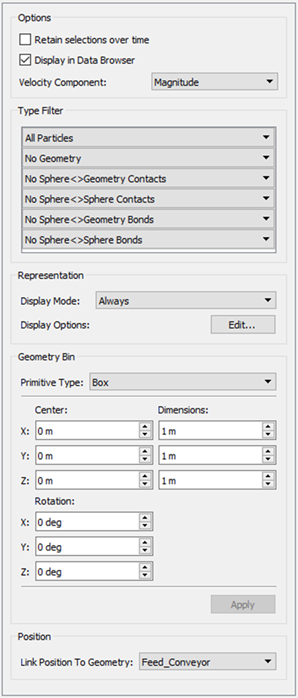
Velocity Profile Sensor
Velocity Profile Sensors can be added to the model to obtain the average velocity of the bulk material within user-specified regions of a simulation.
To analyze the velocity profile of bulk material:
-
From the Analyst, right click Setup Selections, hover over Add Sensor Selection and select Velocity Profile Sensor.
-
Toggling the Retain selections over time checkbox allows the particles that pass through the sensor to be kept as part of the selection group.
-
The Display in Data Browser checkbox toggles the display of the value of the sensor result in the Data Browser window.
-
The Component list allows the user to select the component of velocity they are interested in. Choose from Magnitude, X, Y or Z.
-
The lists in the Type Filter section allow the user to select which particles, Geometries, bonds and types of contact they wish to include / exclude.
-
The representation options allow the user to toggle whether the query is displayed on screen.
-
You can choose between two different primitive shapes for the sensor: box or cylinder.
-
Set the sensor’s dimensions and position.
-
The sensor’s position can be linked to a geometry, which can be useful when analyzing moving Geometries.
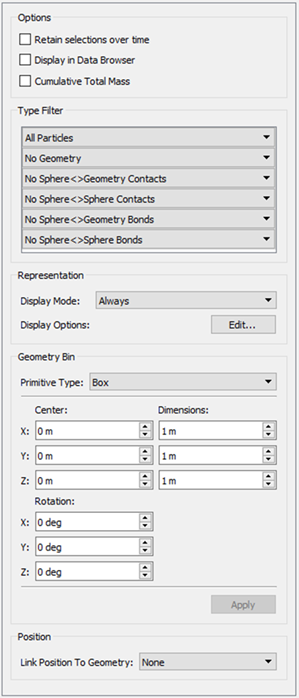
Total Mass Sensor
Total Mass Sensors can be added to the model to measure the total amount of bulk material contained within a region at any one point in time, or cumulatively over a period of time.
To analyze the total mass of material:
-
From the Analyst, right click Setup Selections, hover over Add Sensor Selection and select Total Mass Sensor.
-
Toggling the Retain selections over time checkbox allows the particles that pass through the sensor to be kept as part of the selection group.
-
The Display in Data Browser checkbox toggles the display of the value of the sensor result in the Data Browser window.
-
Toggling the Cumulative Total Mass keeps track of the Total Mass that has passed through the sensor for all analyzed time steps.
-
The lists in the Type Filter section allow the user to select which particles, Geometries, bonds and types of contact they wish to include / exclude.
-
The representation options allow the user to toggle whether the query is displayed on screen.
-
You can choose between two different primitive shapes for the sensor: box or cylinder.
-
Set the sensor’s dimensions and position.
-
The sensor’s position can be linked to a geometry, which can be useful when analyzing moving Geometries.
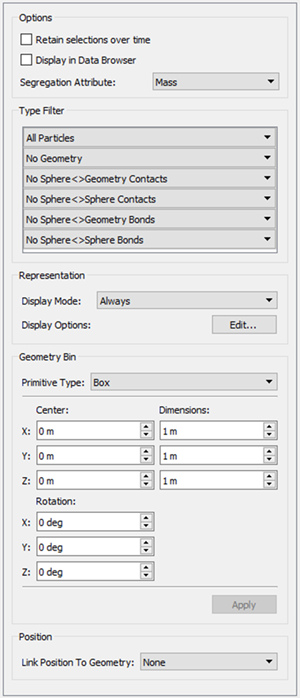
Segregation Sensor
Segregation Sensors can be added to the model to measure the average size of the elements that make up the bulk material contained within a sensor.
Segregation is calculated using:
Volume: 
Mass:
To analyze the segregation of the bulk material:
-
From the Analyst, right click Setup Selections, hover over Add Sensor Selection and select Segregation Sensor.
-
Toggling the Retain selections over time checkbox allows the particles that pass through the sensor to be kept as part of the selection group.
-
The Display in Data Browser checkbox toggles the display of the value of the sensor result in the Data Browser window.
-
The Segregation Attribute list allows the user to select whether they would like to analyze the segregation by Mass or Volume.
-
The lists in the Type Filter section allow the user to select which particles, Geometries, bonds and types of contact they wish to include / exclude.
-
The representation options allow the user to toggle whether the query is displayed on screen.
-
You can choose between two different primitive shapes for the sensor: box or cylinder.
-
Set the sensor’s dimensions and position.
-
The sensor’s position can be linked to a geometry, which can be useful when analyzing moving Geometries.
Bulk Density Sensor
Bulk Density Sensors can be added to the model to measure the average density of the elements that make up the bulk material contained within a sensor.
To analyze the density of the bulk material:
-
From the Analyst, right click Setup Selections, hover over Add Sensor Selection and select Bulk Density Sensor.
-
Toggling the Retain selections over time checkbox allows the particles that pass through the sensor to be kept as part of the selection group.
-
The Display in Data Browser checkbox toggles the display of the value of the sensor result in the Data Browser window.
-
The Density Type list allows the user to select whether they would like to analyze the Bulk Density or Solids Density.
-
The lists in the Type Filter section allow the user to select which particles, Geometries, bonds and types of contact they wish to include / exclude.
-
The representation options allow the user to toggle whether the query is displayed on screen.
-
You can choose between two different primitive shapes for the sensor: box or cylinder.
-
Set the sensor’s dimensions and position.
-
The sensor’s position can be linked to a geometry, which can be useful when analyzing moving Geometries.
Setup Selections - Queries
A query is used to define a single element attribute, for example, particle velocity, total force on a geometry section or number of collisions. The query information can then be displayed in the Viewer and in the Groups section in the Data Browser. Bin cells can also be colored according to the results of the query.
To define a query, click the Edit button in the Options section. The Selection Query Editor is displayed:
- Select an element and attribute from the list. The elements are categorized by type: contacts, geometry, bonds, and particles.
- Use the Type/Section control to choose the section (for geometry elements) or type of element the information will be displayed for: For example, an attribute relating to particles of type A, a particular section of geometry or a contact between two specific particle types.
- The Query type option is used to determine the type of data displayed. Choose from average, maximum, minimum or total: For example the average velocity or the maximum force. This option is only available for certain element attributes.
- Select the component of the attribute you are interested in. Choose from Magnitude, X, Y or Z component: For example, the X component of the particle velocity or the magnitude of the normal force in a surface-surface contact. This option is only available for certain element attributes.
- If applicable, select the Specify range option to constrain the data collected to a particular value range: For example, particle velocities between 1m/s and 10m/s.
- Click the Add button once the query has been fully defined. Multiple queries can be created and added to the list. All queries are automatically added to a table in the selection’s page in the Data browser.
Retain selections over time
When using Manual Selection the particles or geometries selected remain selected over time. If using the other selection options (Grid Bin Group, Geometry Bin etc.) the particles or geometries are only selected by default if the center of the particle or geometry is inside the bin group. Once they move outside the bin they are automatically removed from the selection.
If the “Retain Selections Over Time” option is checked any particles passing through the selection group will selected and remain selected once they have exited the selection group. In the image below a geometry bin has been created, as the particles pass through the bin they are highlighted orange and remain colored once they have left the bin area.
Queries > Contacts
Affects all contacts or any combinations of specific particle-particle or particle-geometry contacts.
| Attribute | Query Type | Component |
|
Contact vector 1. |
Average, maximum, minimum or total. |
Magnitude, X, Y, Z. |
|
Contact vector 2. |
Average, maximum, minimum or total. |
Magnitude, X, Y, Z. |
|
Normal force. |
Average, maximum, minimum or total. |
Magnitude, X, Y, Z. |
|
Normal overlap. |
Average, maximum, minimum or total. |
N/A |
|
Number of contacts. |
N/A |
N/A |
|
Tangential force. |
Average, maximum, minimum or total. |
Magnitude, X, Y, Z. |
|
Tangential overlap. |
Average, maximum, minimum or total. |
N/A |
|
Custom property. |
Average, maximum, minimum or total. |
Depends on number of elements. |
| Contract Normal (Polyhedral) | Average, maximum, minimum or total. | X, Y, Z. |
| Penetration Depth (Polyhedral) | Average, maximum, minimum or total. | N/A |
| Overlap Volume (Polyhedral) | Average, maximum, minimum or total. | N/A |
Queries > Bonds
Affects all bonds or any combinations of specific particle-particle bonds.
| Attribute | Query Type | Component |
|
Normal force. |
Average, maximum, minimum or total. |
Magnitude, X, Y, Z. |
|
Normal moment. |
Average, maximum, minimum or total. |
Magnitude, X, Y, Z. |
|
No. of broken bonds. |
N/A |
N/A |
|
No. of intact bonds. |
N/A |
N/A |
|
Tangential force. |
Average, maximum, minimum or total. |
Magnitude, X, Y, Z. |
|
Tangential moment. |
Average, maximum, minimum or total. |
Magnitude, X, Y, Z. |
Queries > Geometry
Affects all geometry or a particular section (as specified in the Creator).
| Attribute | Query Type | Component |
|
Compressive force. |
Average, maximum, minimum or total. |
N/A |
|
Number of geometry elements. |
N/A |
N/A |
|
Pressure |
Maximum, minimum or total pressure. |
N/A |
|
Total force |
Average, maximum, minimum or total. |
Magnitude, X, Y, Z. |
|
Torque (element) |
Average, maximum, minimum or total. Total is the sum of the individual element torque values. |
Magnitude, X, Y, Z. |
|
Velocity |
Average, maximum, minimum or total. |
Magnitude, X, Y, Z. |
|
Custom property. |
Average, maximum, minimum or total. |
Depends on number of elements. |
Queries > Particles
Affects all particles or a particular particle type (as specified in the Creator). To cumulatively sum the number of particles over a period of time, select the 'Total over time' option. As you step forward through the simulation the total number of particles will be recorded. Cumulative particle totals for bin groups only works when stepping forward through your simulation: if you jump back, the totals may not be accurate.
| Attribute | Query Type | Component |
|
Angular velocity. |
Average, maximum, minimum or total. |
Magnitude, X, Y, Z. |
|
Compressive force. |
Average, maximum, minimum or total. |
N/A |
|
Coordination number. |
Average, maximum, minimum or total. |
N/A |
|
Diameter |
Average, maximum, minimum or total. |
N/A |
|
Moment of inertia. |
Average, maximum, minimum or total. |
Magnitude, X, Y, Z. |
|
Kinetic energy. |
Average, maximum, minimum or total. |
N/A |
|
Mass |
Average, maximum, minimum or total. |
N/A |
|
Number of particles. |
Total-over-time checkbox. |
N/A |
|
Potential energy. |
Average, maximum, minimum or total. |
N/A |
|
Residence time. |
Average, maximum, minimum or total. |
N/A |
|
Rotational kinetic energy. |
Average, maximum, minimum or total. |
N/A |
|
Torque |
Average, maximum, minimum or total. |
Magnitude, X, Y, Z. |
|
Total energy. |
N/A |
N/A |
|
Total force. |
Average, maximum, minimum or total. |
Magnitude, X, Y, Z. |
|
Velocity |
Average, maximum, minimum or total. |
Magnitude, X, Y, Z. |
|
Voidage [1] |
Total |
N/A |
|
Volume |
Average, maximum, minimum or total. |
N/A |
|
Custom property. |
Average, maximum, minimum or total. |
Depends on number of elements. |
Setup Selections - Type Filter
The Type Filter section is used to determine which elements in your model are included. By default all particles (but nothing else) are included in the group, if No Geometry or No Contacts are chosen then no data will be exported for the selected query type.
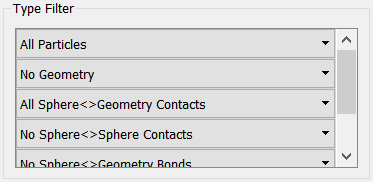
For any element, click the pull-down menu to select all, none, or selected elements:
|
Element |
Filter Options |
|
Particles. |
All Particles, No Particles, Selected Particles. |
|
Geometry. |
All Geometry, No Geometry, Selected Geometry. |
|
Surface - Geometry Contacts. |
All Surface-Geometry Contacts, No Surface-Geometry Contacts, Selected Surface-Geometry Contacts. |
|
Surface - Surface Contacts. |
All Surface-Surface Contacts, No Surface-Surface Contacts, Selected Surface-Surface Contacts. |
|
Surface - Geometry Bonds. |
All Surface-Surface Contacts, No Surface-Surface Contacts, Selected Surface-Surface Contacts. |
|
Surface - Surface Bonds. |
All Surface-Surface Bonds, No Surface-Surface Bonds, Selected Surface-Surface Bonds. |
For selected elements, tick the checkbox for all elements to include.
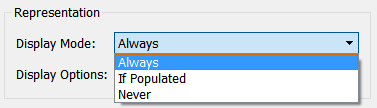
Setup Selections - Representation
- Display Mode
For bins and bin groups, the display mode determines how bins are rendered in the viewer.- Always - All bins are always displayed.
- If Populated - Bins are only displayed when they contain elements enabled in the type filter.
- Never - Bins are not displayed. When several selections exist this can cause confusion, so you can choose this option to turn off specific selections.
- Display Options
Display options let you specify which query is displayed in the viewer, as well as set highlighting and coloring options for individual bins (sub-selections). Click the Edit button to open the Display Options. - On Screen Display
For bins and bin groups, tick the On Screen Query checkbox then select which selection group query to display in the viewer.
For grid and geometry template selections, select options to highlight and color sub-selections. Bins can be colored in one of two ways: Highlighting individual bins, or coloring bins by a specific query. - Highlight Sub-Selection
Select which particular bin in the bin group to highlight. Only one bin can be highlighted at a time. Bins in grid bin groups are identified using an ID matrix; bins in imported template selections use the geometry names from the imported file (if available). - Sub-Selection Coloring
- Choose a query from the drop-down list.
- Set the value range. This is determined by setting the minimum and maximum query values. The values can be entered directly or can be read from the model by clicking the update buttons. This takes the current maximum and minimum values of the selected query. If the auto-update options are selected, these values will automatically update according to the time step being viewed. Bins will then be colored depending on whereabouts in the range they fall. The colors used are fixed from blue (minimum), through green, to red (maximum).
- Select the Legend option to display a color legend in the Viewer.
- Use the opacity option to vary the opacity of the bin coloring.
- Bin groups can be colored according to any pre-defined query: For example, bins could be colored by the number of collisions taking place in them, or by the average speed of the particles they contain.