Creating a Histogram
A histogram is a graphical display of tabulated frequencies. For example, the figure below is a histogram which shows the number of particles traveling in particular velocity ranges.
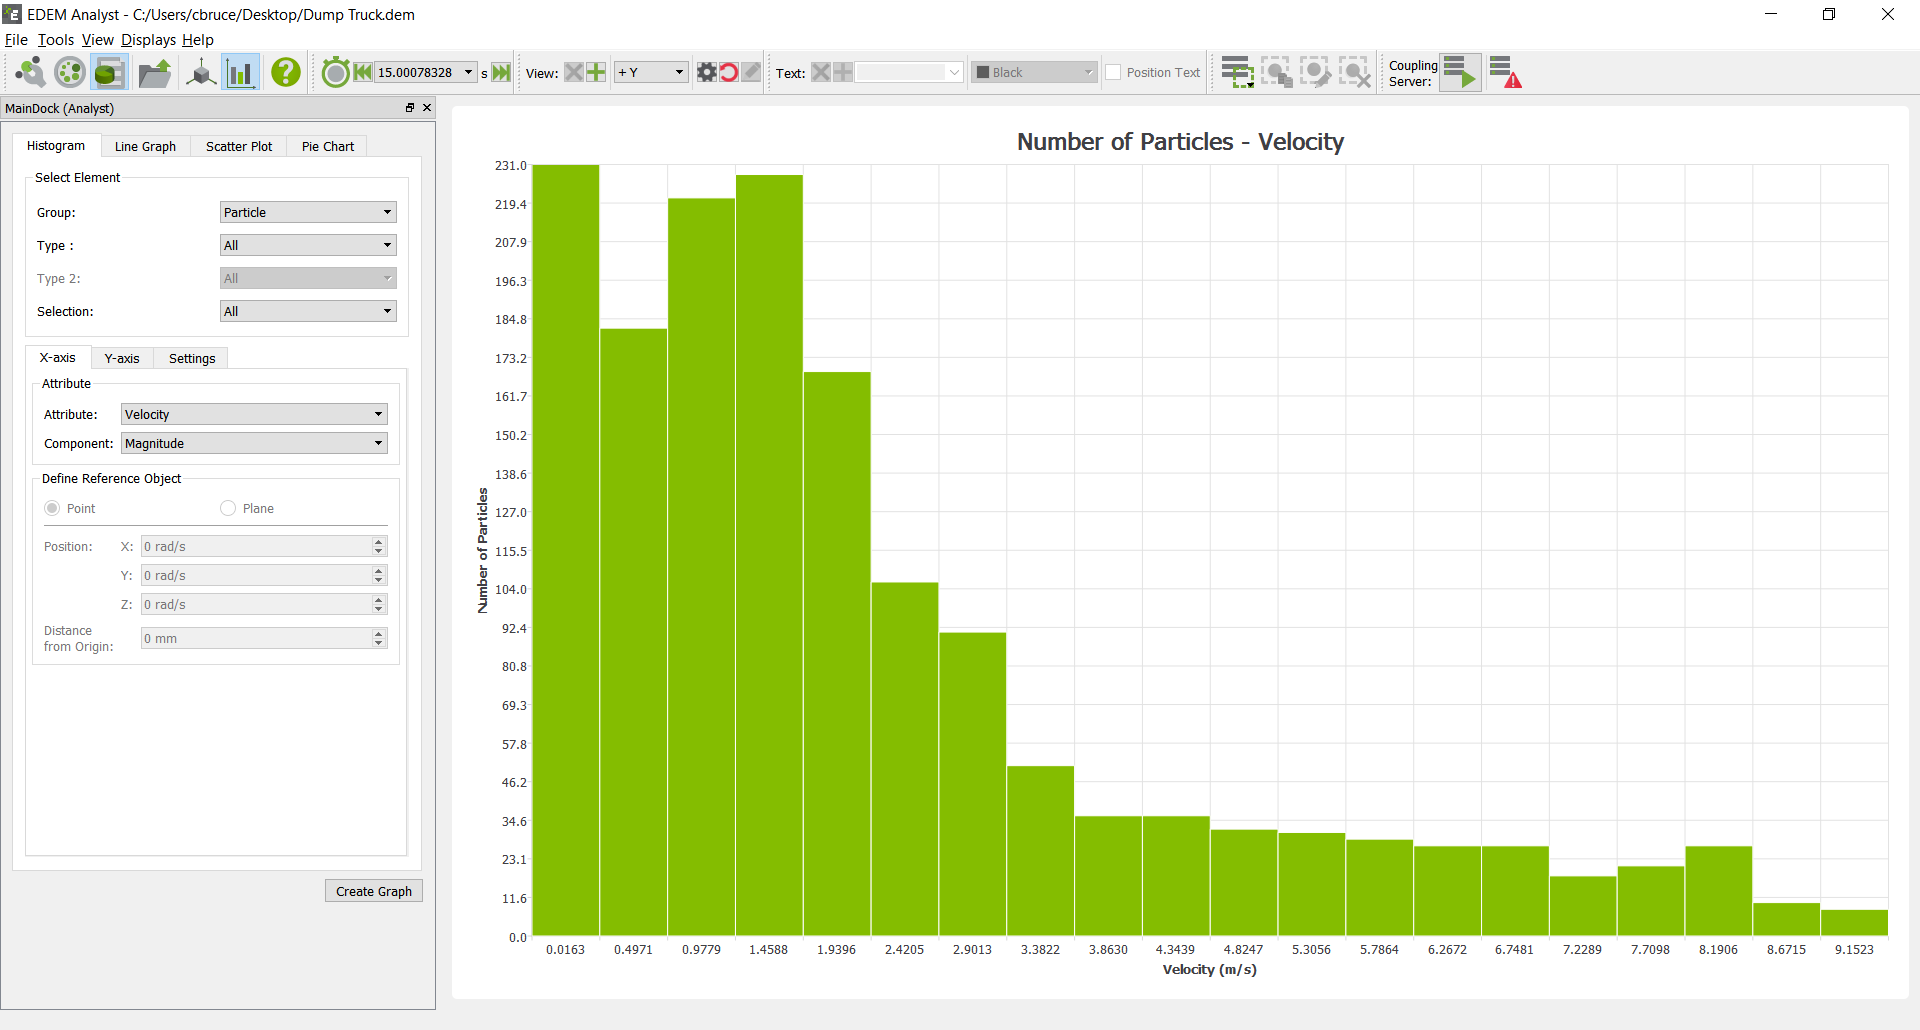
Selecting the Elements to Graph
The Select Element section is used to determine which elements to collect data from. Choose the group or type of elements you are interested in.
| Group | Type |
|
Particle |
All or any individual particle type (as specified in the Creator). |
|
Geometry |
All or any individual section (as specified in the Creator). |
|
Contact |
All or any combination of specific particle types or geometry sections. |
|
Collision |
All or any combination of specific particle types or geometry sections. |
|
Bond |
All or any combination of specific particle types. |
Configuring the X-Axis
Click on the X-axis tab then select the attribute and component to plot on the x-axis. The attributes available in the list will depend on the elements previously selected. The table below shows the attributes and components available for each element. Refer to Appendix A: Attribute Definitions for more information on attributes.
| Element | Attribute | Components |
| Particle |
Angular velocity. |
Magnitude, X, Y, Z. |
|
Compressive force. |
N/A |
|
|
Diameter |
N/A |
|
|
Distance |
Define reference object*. |
|
|
Kinetic energy. |
N/A |
|
|
Mass |
N/A |
|
|
Potential energy. |
N/A |
|
|
Residence time. |
N/A |
|
|
Rotational kinetic energy. |
N/A |
|
|
Time |
N/A |
|
|
Torque |
Magnitude, X, Y, Z. |
|
|
Total energy. |
N/A |
|
|
Total force. |
Magnitude, X, Y, Z. |
|
|
Velocity |
Magnitude, X, Y, Z. |
|
|
Volume |
N/A |
|
|
Custom property. |
Depends on number of elements. |
|
| Geometry |
Time |
N/A |
| Contact |
Contact vector 1. |
Magnitude, X, Y, Z. |
|
Contact vector 2. |
Magnitude, X, Y, Z. |
|
|
Distance |
Define reference object*. |
|
|
Normal overlap. |
N/A |
|
|
Normal force. |
Magnitude, X, Y, Z. |
|
|
Tangential force. |
Magnitude, X, Y, Z. |
|
|
Tangential overlap. |
N/A |
|
|
Time |
N/A |
|
|
Custom property. |
Depends on number of elements. |
|
| Collision |
Average normal force. |
Magnitude, X, Y, Z. |
|
Average tangential force. |
Magnitude, X, Y, Z. |
|
|
Distance |
N/A |
|
|
Duration |
N/A |
|
|
Maximum normal force. |
Magnitude, X, Y, Z. |
|
|
Maximum tangential force. |
Magnitude, X, Y, Z. |
|
|
Normal energy loss. |
N/A |
|
|
Number of collisions. |
N/A |
|
|
Relative velocity. |
Magnitude, X, Y, Z. |
|
|
Relative velocity normal. |
Magnitude, X, Y, Z. |
|
|
Relative velocity tangential. |
Magnitude, X, Y, Z. |
|
|
Tangential energy loss. |
N/A |
|
|
Time |
N/A |
|
|
Total energy loss. |
N/A |
|
|
Velocity element A**. |
Magnitude, X, Y, Z. |
|
|
Velocity element B. |
Magnitude, X, Y, Z. |
|
| Bond |
Normal force. |
Magnitude, X, Y, Z. |
|
Normal moment. |
Magnitude, X, Y, Z. |
|
|
Tangential force. |
Magnitude, X, Y, Z. |
|
|
Tangential moment. |
Magnitude, X, Y, Z. |
|
|
Time |
N/A |
* If the attribute is set to Distance you must define a point or plane from which the distance is measured. When distance is selected the Define Reference Object section of the pane will be activated. Choose Point or Plane and define its position and, for a plane, its distance from the origin.
** The velocity of the first element in the collisions. Similarly for Velocity element B.
The x and y axes are related. The attribute you choose to measure on the x-axis will limit those available to measure on the y-axis. Similarly if the y-axis is configured first the attributes available on the x-axis will be limited.
Configuring the Y-Axis
Click on the Y-axis tab and select the element attribute and component to be plotted on the y-axis. The attributes available in the list will depend on the elements previously selected and the attribute being measured on the x-axis. A component type can also be selected for certain attributes. This is used to determine which value will be graphed for a particular attribute component: For example, maximum, minimum or average particle velocity. The table below shows the range of attributes, components and component types available for each element. Refer to Appendix A: Attribute Definitions for more information on attributes.
| Element | Attribute | Components | Type |
| Geometry | Angular Velocity | Magnitude, X, Y, Z. | Average, Max, Min, or CoG. |
|
Center of Mass |
Magnitude, X, Y, Z. |
Average, Max, Min. |
|
|
Compressive force. |
N/A |
Average, Max, Min, or Total. |
|
|
Distance |
N/A |
Average, Max or Min. |
|
|
Pressure |
N/A |
Total Pressure, Max, Min. |
|
|
Torque (element) |
Magnitude, X, Y, Z. |
Average, Max, Min, or Total. |
|
|
Total force. |
Magnitude, X, Y, Z. |
Average, Max, Min, or Total. |
|
|
Velocity |
Magnitude, X, Y, Z. |
Average, Max, Min, or GoG. |
|
|
Custom property. |
Depends on no. of elements. |
Average, Max, Min, or Total. |
|
| Particle |
Angular velocity. |
Magnitude, X, Y, Z. |
Average, Max, Min, or Total. |
|
Compressive force. |
N/A |
Average, Max, Min, or Total. |
|
|
Diameter |
N/A |
Average, Max, Min, or Total. |
|
|
Distance |
Define ref. object*. |
Average, Max or Min. |
|
|
Kinetic energy. |
N/A |
Average, Max, Min, or Total. |
|
|
Mass |
N/A |
Average, Max, Min, or Total. |
|
|
Number of particles. |
N/A |
Total or Total in Range**. |
|
|
Potential energy. |
N/A |
Average, Max, Min, or Total. |
|
|
Residence time. |
N/A |
Average, Max, Min, or Total. |
|
|
Rotational kinetic energy. |
N/A |
Average, Max, Min, or Total. |
|
|
Torque |
Magnitude, X, Y, Z. |
Average, Max, Min, or Total. |
|
|
Total energy. |
N/A |
Average, Max, Min, or Total. |
|
|
Total force. |
Magnitude, X, Y, Z. |
Average, Max, Min, or Total. |
|
|
Velocity |
Magnitude, X, Y, Z. |
Average, Max, Min, or Total. |
|
|
Volume |
N/A |
Average, Max, Min, or Total. |
|
|
Custom property. |
Depends on no. of elements. |
Average, Max, Min, or Total. |
|
| Contact |
Contact vector 1. |
Magnitude, X, Y, Z. |
Average, Max or Min. |
|
Contact vector 2. |
Magnitude, X, Y, Z. |
Average, Max or Min. |
|
|
Distance |
Define ref. object*. |
Average, Max or Min. |
|
|
Normal force. |
Magnitude, X, Y, Z. |
Average, Max, Min, or Total. |
|
|
Normal overlap. |
N/A |
Average, Max or Min. |
|
|
Number of contacts. |
N/A |
Total or Total in Range**. |
|
|
Tangential force. |
Magnitude, X, Y, Z. |
Average, Max, Min, or Total. |
|
|
Tangential overlap. |
N/A |
Average, Max or Min. |
|
|
Custom property. |
Depends on no. of elements. |
Average, Max, Min, or Total. |
|
| Collision |
Average normal force. |
Magnitude, X, Y, Z. |
Average, Max, Min, or Total. |
|
Average tangential force. |
Magnitude, X, Y, Z. |
Average, Max, Min, or Total. |
|
|
Distance |
Define ref. object*. |
Average, Max or Min. |
|
|
Duration |
N/A |
Average, Max or Min. |
|
|
Maximum normal force. |
Magnitude, X, Y, Z. |
Average, Max, Min, or Total. |
|
|
Maximum tangential force. |
Magnitude, X, Y, Z. |
Average, Max, Min, or Total. |
|
|
Normal energy loss. |
N/A |
Average, Max, Min, or Total. |
|
|
Number of collisions. |
N/A |
Total or Total in Range**. |
|
|
Relative velocity. |
Magnitude, X, Y, Z. |
Average, Max, Min, or Total. |
|
|
Relative velocity normal. |
Magnitude, X, Y, Z. |
Average, Max, Min, or Total. |
|
|
Relative velocity tangential. |
Magnitude, X, Y, Z. |
Average, Max, Min, or Total. |
|
|
Tangential energy loss. |
N/A |
Average, Max, Min, or Total. |
|
|
Total energy loss. |
N/A |
Average, Max, Min, or Total. |
|
|
Velocity of element A. |
Magnitude, X, Y, Z. |
Average, Max, Min, or Total. |
|
|
Velocity of element B. |
Magnitude, X, Y, Z. |
Average, Max, Min, or Total. |
|
| Bond |
Normal force. |
Magnitude, X, Y, Z. |
Average, Max, Min, or Total. |
|
Normal moment. |
Magnitude, X, Y, Z. |
Average, Max, Min, or Total. |
|
|
No. of broken bonds. |
N/A |
Total, Total in range. |
|
|
No. of intact bonds. |
N/A |
Total, Total in range. |
|
|
Tangential force. |
Magnitude, X, Y, Z. |
Average, Max, Min, or Total. |
|
|
Tangential moment. |
Magnitude, X, Y, Z. |
Average, Max, Min, or Total. |
* If the attribute is set to Distance you must define a point or plane from which the distance is measured. When distance is selected the Define Reference Object section of the pane will be activated. Choose the point or plane from which the distance should be measured. A point is defined by its xyz position and a plane by its orientation and distance from the origin.
** When the axis is set to measure the number of particles or number of contacts, it is possible to graph either the total number of particles/contacts or the total number in a defined range: For example, counting only those particles with a mass between 0.1kg and 0.2kg or velocity between 2m/s and 5m/s. When the Total in Range option is selected the Secondary Attribute section of the pane is activated. Choose the attribute and component you wish to restrict the range by and enter the maximum and minimum values of that range.
Graphing Settings
-
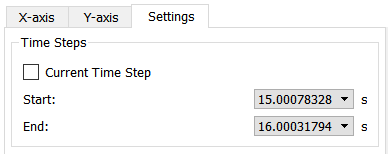
Time Step
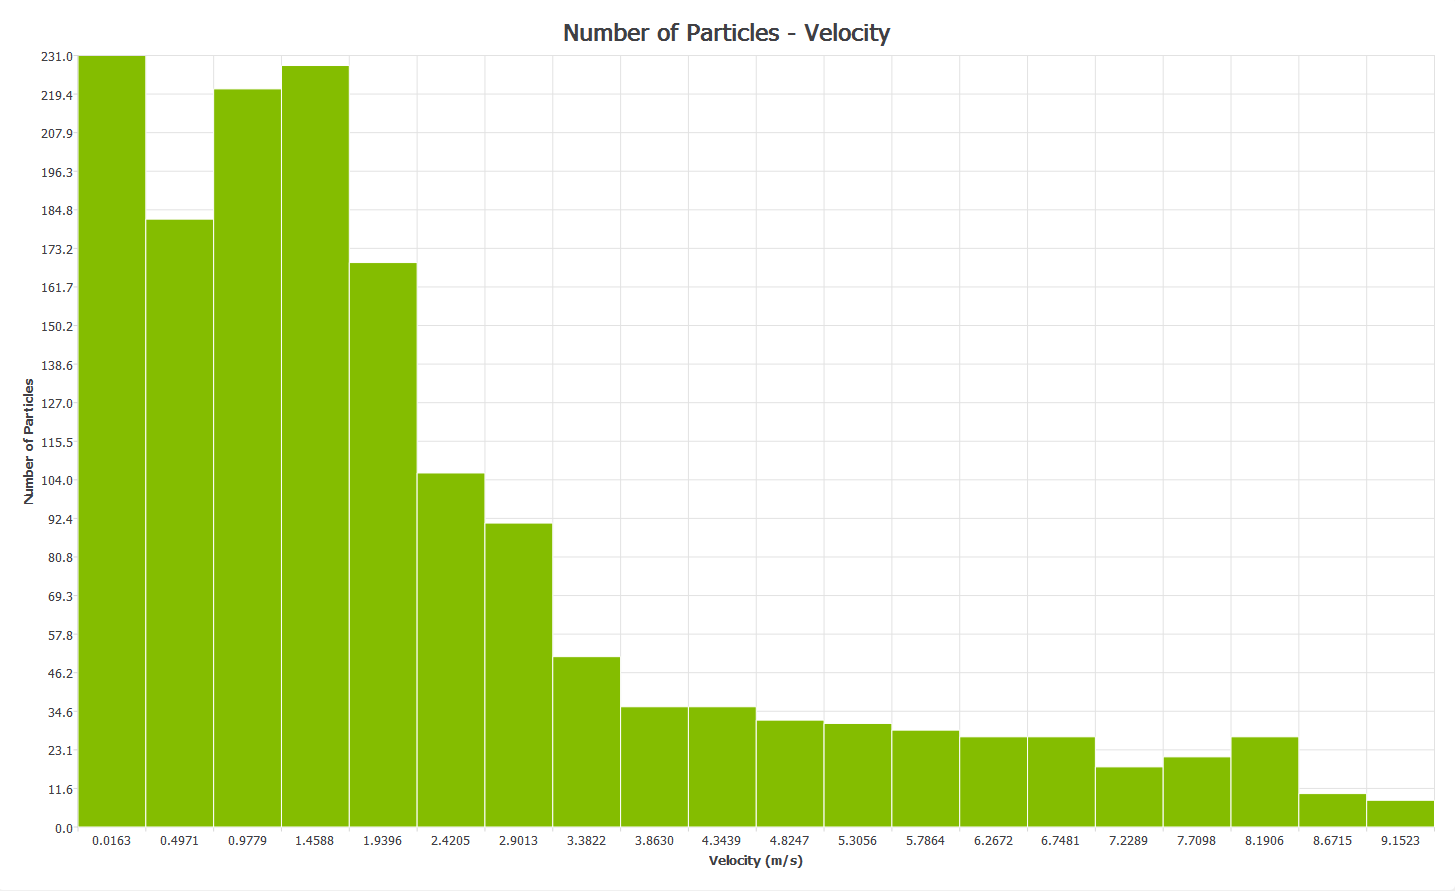
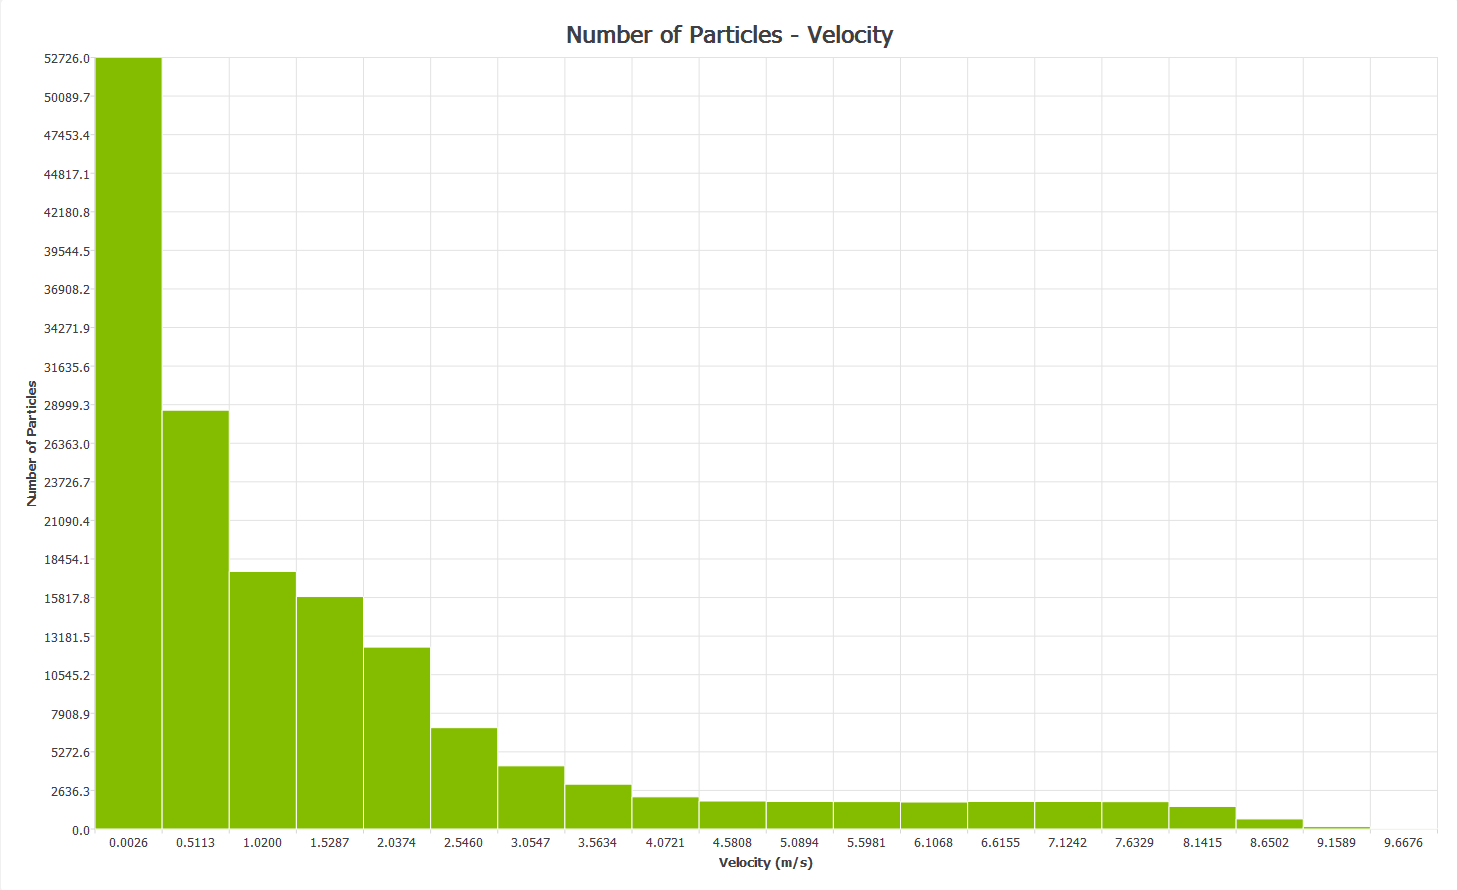
Graphs can be created for elements in a particular time step or over a range of time steps. By default the Current Time step option is selected. The current time step can be changed using the Current Time control in the Viewer control pane at the right of the screen. For example, the figure below shows two histograms each showing the number of particles traveling in particular velocity ranges. The graph on the top is for one time step, so each particle is only counted once. The graph on the bottom is for a range of 100 time steps.
Histograms showing the distribution of particle velocities:
Unselect the Current Time Step to set a different start and end time. Grayed-out time steps indicate partial saves and may not contain all the data you want to plot:
-
Axis Range
The x and y axis ranges can be determined automatically (from the values of the attributes selected) or entered manually. The number of intervals on each axis should also be defined. A greater number of intervals increases the accuracy of the chart. -
Display Options
Click the Display Options button to open the dialog. -
Title. Set the graph title.
-
X-label, Y-label. Can be determined automatically or entered manually.
-
Show grid. Turn the interval grid on and off.
-
Show average value. Turn the display of a horizontal line showing the average value on and off.
-
Show minimum value. Turn the display of a horizontal line showing the minimum value on and off.
-
Show maximum value. Turn the display of a horizontal line showing the maximum value on and off.
Create the Graph
Create the graph once the axes have been configured and the time step and display options set. Click on the Create Graph button to draw the graph. Use the Clear Graph button to clear it. If any setting is altered (including changing the units) click the Create Graph button to view the graph with the changes.
To save the graph data, right-click on the graph then select Export as Text.