Creating a Line Graph
A line graph is used to measure any variable over time. That is, how the value of a particular variable changes over a specified time.
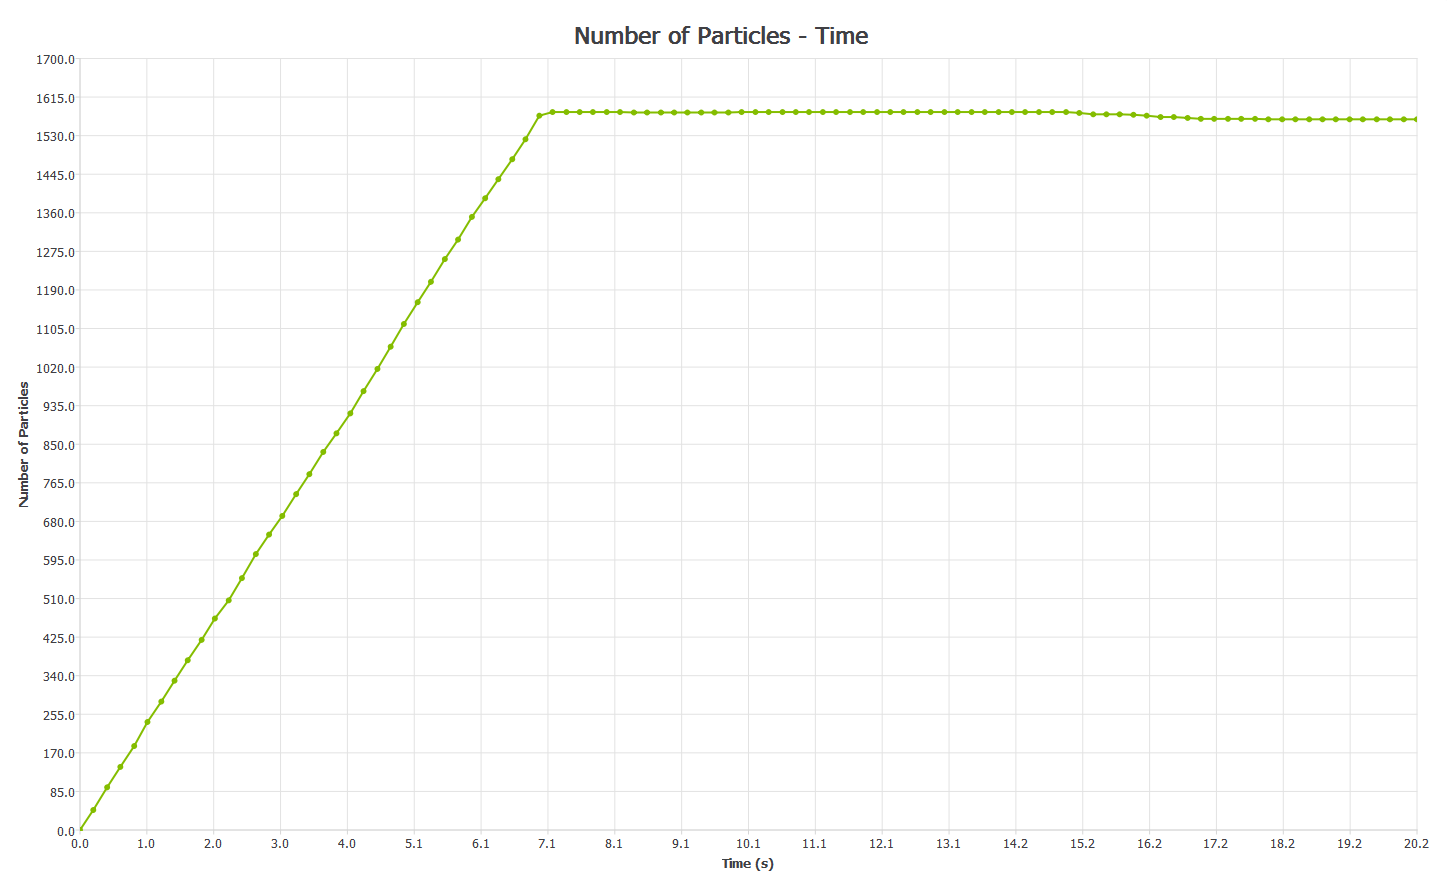
Line Graph Showing the number of particles in a simulation:
Selecting the Elements to Graph
The Select Element section is used to determine which elements in your model to collect data from. Choose the group of elements, the type of elements within that group and which selection of those elements you are interested in.
Configuring the X-Axis
Click on the X-axis tab. In a line graph the X-axis always measures time. Use the Start and End controls to set the range of time over which to plot your data. Grayed-out time steps indicate partial saves and may not contain all the data you want to plot.
Enable the Logarithmic Scale tick box in order to visualize a logarithmic increment of the Time in the X axis.
Set the number of intervals on the axis: a greater number of intervals increases the accuracy of the chart. Set the maximum number of points to display. Reducing the number of points may make the graph more readable.
Configuring the Y-Axis
Click on the Y-axis tab and select the element attribute and component to be plotted on the y-axis. The attributes available in the list will depend on the elements previously selected. A component type can also be selected for certain attributes. This is used to determine which value will be graphed for a particular attribute component: For example, maximum, minimum or average particle velocity.
It is possible to define several attributes in different Y-Axis and visualize them in the same Line graph. To do that, add Y Axis to the dropdown list and define the attributes of each one of them while selected. You can visualize all of them in the same scale by enabling the tick box “Display same axis scale for all Y axes”.
When graphing the number of elements (i.e. number of particles, contacts or collisions) any interpolated data points (those constructed from the discrete set of known data points) are rounded down to the nearest whole number.
Element attribute options are the same as for a Histogram (with the exception of collisions and Torque).
Plotting Torque along a Line Graph
EDEM calculates individual contact forces between particles and geometry elements (triangles). The Force has a position on a triangle and the triangle has a relative position to the associated Geometry Section (e.g. Screw Blade).
When plotting Torque > Total > X, Y or Z the Contact Force is converted to a Torque for the Geometry section. The axis for this torque is the chosen X, Y or Z axis which goes through the geometry Center of Mass.
Alternatively a user defined axis can be used (recommended), the user sets a vector for the chosen geometry section and the torque is exported along this axis for the named Geometry Section.