ProbabilityDistribution
The block is used to estimate the probability functions (PDF, CDF, Mean, and Variance) of a random signal. The block is usually used with a vector scope.
![]()
Library
Misc
Description
The ProbabilityDistribution block is used to estimate the Probability Density Function (PDF), Cumulative Distribution Function (CDF), and mean and variance of a random signal.
Upper and lower limits define a window to measure the variation of the amplitude of the input random signal. This window is divided into segments where the number of segments is also a parameter of the block.
At event instants, using on the previous values of the input signal, PDF, CDF, Mean and Variance of the signal are updated and given at the output of the block.
If the compute mode is PDF, the first output is the PDF values as function of the second output (the segemnt positions).
If the compute mode is CDF, the first output is the CDF values as function of the second output (the segemnt positions).
If the compute mode is Mean/variance, the first output is the mean value of the signal and the second outputs is the variance of the signal.
In order to display the PDF or CDF of the signal, the outputs of the block are connected to a Vector-scope (located in the SignalViewers palette). In PDF and CDF modes, first and second outputs of the block are considered as the y-coordinate and x-coorinate of the PDF/CDF curves, respectively.
Note that if the window, defined by the lower and upper limit parameters, does not cover the variation of the amplitude of the signal, spikes may appear at the first and last segment of the PDF or CDF curves.
In PDF and CDF, the distribution range to be dispalyed is defined between Lower limit and Upper limit. This range will be divided into N segment where N is given by the user by the parameter 'Number of segments'.
There will be two additional segments to indicate the probability distribution less than and higher than the Lower and Upper limits respectively. As a result, there will be N+2 points on the second output of this block representing N+2 segments.
.
.
.
Parameters
| Name | Label | Description | Data Type | Valid Values |
|---|---|---|---|---|
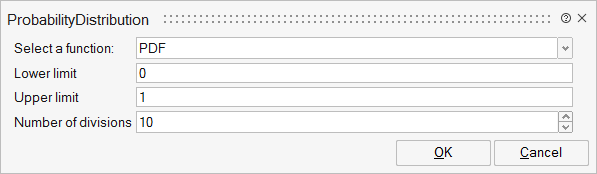
statfunc | Select a function: | Structure | ||
statfunc/pdf | Compute the Probability Density Function of the input signal. | Number | 1 | |
statfunc/cdf | CDF | Compute the Cumulative Distribution Function of the input signal. | Number | 1 |
statfunc/mean | Mean-Variance | compute Mean and Variance of the input signal. | Number | 1 |
lower | Lower limit | Lower limit of the observation window. Input sigals smaller than this value are cut to this value. | Matrix of size 1x1 | |
upper | Upper limit | Upper limit of the observation window. Input sigals bigger than this value are cut to this value. | Matrix of size 1x1 | |
N | Number of divisions | Number of segments for the observation window. | Number |
Ports
| Name | Type | Description | IO Type | Number |
|---|---|---|---|---|
Port 1 | explicit | The (random) signal is connected to this port. | input | 1 |
Port 2 | explicit | In PDF or CDf modes, the output is either the PDF or CDF function as a function of the second output. In the Mean-Variance mode, this output is the Mean value of the signal. | output | 1 |
Port 3 | explicit | In PDF or CDf modes, this output is used as the x-coordinate to display the PDF or CDF curves. In the Mean-Variance mode, this output is the Variance value. | output | 2 |
Port 4 | activation | The outputs of the block are updated each time the block is activated via this input event port. | input | 1 |
Advanced Properties
| Name | Value | Description |
|---|---|---|
always active | no | |
direct-feedthrough | yes | |
zero-crossing | no | |
mode | no | |
continuous-time state | no | |
discrete-time state | no |