ScopeXY
This block animates (X,Y) data, drawing the second input as a function of the first.
![]()
Library
SignalViewers
Description
The ScopeXY block displays the evolution of the two regular inputs signals by drawing the second input as a function of the first at instants of events on the event input port.
When a point is drawn on screen it stays until the simulation is finished.
Parameters
| Name | Label | Description | Data Type | Valid Values |
|---|---|---|---|---|
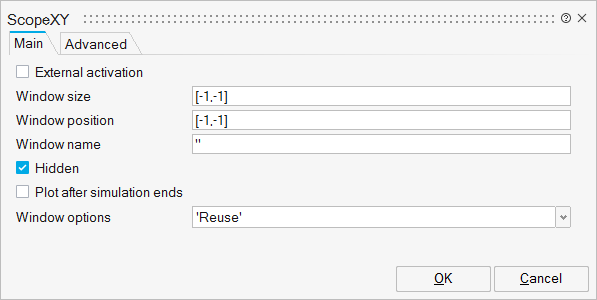
externalActivation | External activation | Specifies whether the block receives an external activation or inherits its activation through its regular input ports. When External Activation is selected, an additional activation port is added to the block. By default, external activation is not selected. | Number | 0 |
winSize | Window size | X,Y dimension of the plot window. Integer values. Default size is given as [-1,-1] and corresponds to [400,400]. | Vector of size 2 | |
winPos | Window position | X,Y position of the plot window. Integer values. Default [-1,-1] indicates the scope is positioned automatically. | Vector of size 2 | |
winNam | Window name | Name of the plot window. String. Default is empty. | String | |
winHidden | Hidden | The window is hidden initially by default. | Number | 0 |
showAtEnd | Plot after simulation ends | Display the plots (lines) at the end of simulation instead of progressively along with simulation time. | Number | 0 |
option | Window options | Define the scope window setting for a simulation. Default is 'Reuse'. | String | 'Reuse' |
| Name | Label | Description | Data Type | Valid Values |
|---|---|---|---|---|
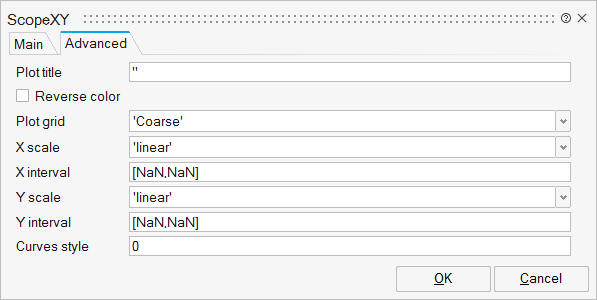
plotTitle | Plot title | Title of the plot | String | |
plotColor | Reverse color | Flag to reverse the colors in the plot | Number | 0 |
plotGrid | Plot grid | Grid line layout | String | 'No |
xScale | X scale | Scale of X axis | String | 'linear' |
xInterval | X interval | Limits of X axis | Vector of size 2 | |
yScale | Y scale | Scale of Y axis | String | 'linear' |
yInterval | Y interval | Limits of Y axis | Vector of size 2 | |
curvesStyle | Curves style | Style of the plot curves and markers | Vector |
Ports
| Name | Type | Description | IO Type | Number |
|---|---|---|---|---|
Port 1 | explicit | input | 1 | |
Port 2 | explicit | input | 2 | |
Port 3 | activation | input | externalActivation |
Advanced Properties
| Name | Value | Description |
|---|---|---|
always active | no | |
direct-feedthrough | yes | |
zero-crossing | no | |
mode | no | |
continuous-time state | no | |
discrete-time state | no |