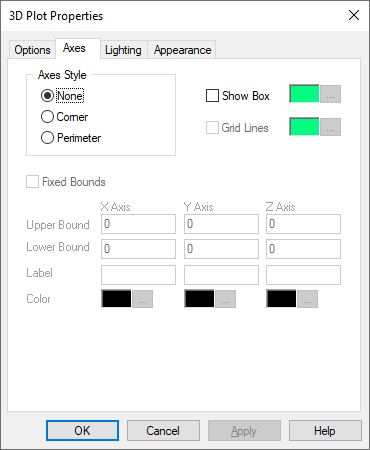
Corner: Indicates that the axes extend from a single corner. The axes remain fixed, even as you rotate the 3D object.
None: Indicates that no axes are displayed.
Perimeter: Indicates that the axes extend from the perimeter of the plot. The axis lines move as you rotate the 3D object. Additionally, the axes remain in front of the 3D object.
Color: Specifies colors for the x-, y-, and z-axes. To specify the color for an axis and its label, click … . The color you choose is previewed next to Color.
Fixed Bounds: When you activate Fixed Bounds, you can specify the region of the plot that you want to view by selecting the plotting bounds. The plotting bounds are obtained from the values specified in X-Axis, Y-Axis, and Z-Axis Upper and Lower Bound.
The 3D plot coordinate system is shown below:

Grid Lines: Extends grid lines from the three axes. Grid frequency – that is, the x, y, and z spacing of grid lines – is controlled by the spacing of the axis coordinates. Embed automatically establishes reasonable axis coordinate spacing and hence controls the grid frequency.
To change the color of the bounding box, click the corresponding …. After you select a color, it is displayed to the left of the … button.
Label: Specifies labels to the x, y, and z axes. Axis labels can contain up to 80 alphanumeric characters.
Show Box: Establishes a bounding box around the 3D object. To change the color of the bounding box, click the corresponding … button. After you select a color, it is displayed to the left of the … button.
X-Axis, Y-Axis, and Z-Axis Upper and Lower Bounds: Determines the upper and lower plotting bounds for the x, y, and z axes. You can specify the bounds only when Fixed Bounds is activated.