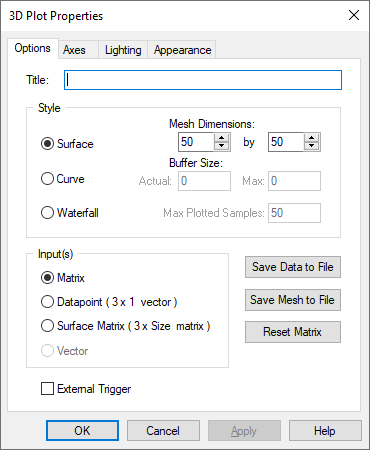
External Trigger: You can set an external trigger to determine if data is displayed in the plot based on the value of the trigger. When activated, External Trigger places a round input connector on the 3Dplot block. When signal values entering the external trigger are 1, data is plotted; when signal values entering the external trigger are 0, data is not plotted.
Datapoint: Data points in 3D space that can draw a trajectory or a parametric surface. A parametric surface accepts a 3 x 1 vector on each simulation. It is defined as follows:
x = x(u,v)
y = y(u,v)
z = z(u,v)

Matrix: An n x m array of data that defines the surface of the plotting object.
x, y = matrix dimensions
z = value of Axy
Surface Matrix: Accepts the following:
3 x (first-mesh-dimension * second-mesh-dimension)
The matrix provides the entire mesh at once.
Vector: A 1 x n array of data that defines the surface of the plotting object. You can only specify this type of input for a waterfall plot.
Reset Matrix: Undoes the position and rotation applied to the 3D object and resets the object to correspond to its initial transformation matrix. When resetting the transformation matrix, Embed brings the 3D axes (and eventually the 3D object) back into their initial position. The x-axis is parallel to the plane of the screen and points from left to right; the z-axis is parallel to the plane of the screen and its positive direction is bottom to top; and the y-axis is perpendicular to the screen pointing from the viewer.
Save Data to File: Saves the data points to a DAT file. Each x, y, and z coordinate is saved to a single, comma-separated line in the file. A header is included at the top of the file that identifies when it was created and the diagram from which it was created. The DAT file can be used as input to any block that recognizes DAT files, such as the import block.
Save Mesh to File: Saves the mesh as a DirectX file (X) and can be used with any application that accepts X files.
Buffer Size: Indicates the actual number and maximum number of data points to be plotted. If the value entered in Max is 0, the value entered in Actual is used to plot the object. Actual is a read-only parameter; it cannot be changed.
Curve: Plots a 3D curve or line. The following is 3D curve plot of the Lorenz attractor:

Max Plotted Samples: Indicates the number of data vectors to be plotted simultaneously. This parameter is available only when you have selected a waterfall plot style.
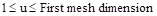
Mesh Dimensions: Specifies the mesh dimensions. The mesh dimensions should be close to the number of nodes used to produce the 3D object; otherwise, the 3D object may appear distorted when plotted.
Surface: Generates a surface 3D plot. Input for a surface plot can be matrix, datapoints, or surface matrix.
You can control specific characteristics of the surface plot under the Axes, Lighting, and Appearance tabs.
Waterfall: Plots multiple snapshots of 1 x n vector data. In a waterfall plot, all the snapshots of data are displayed in a single image where each snapshot is offset from the previous snapshot. Input must be a 1 x n vector.
You can control specific characteristics of waterfall plot under the Axes, Lighting, and Appearance tabs.
Title: Provides a name for the 3D plot. Titles can be up to 80 alphanumeric characters. The title appears in the 3D plot title bar. By default, 3D plots are titled Plot3D.