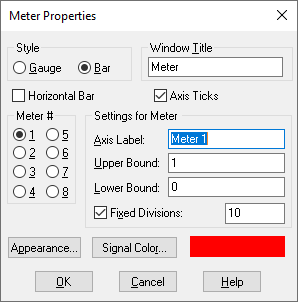

Appearance: Opens the
Appearance dialog box. Click Foreground to color the axis label
and scale text; click Background to color the plotting area. The color
you specify overrides the color specified with View > Colors.
You can alternatively specify a bitmap image background for the plotting
area. Type the file name directly into the Bitmap box or select one using
Select Bitmap. The specified bitmap image file overrides any
background color selection.
Axis Ticks: Displays grid ticks established by Fixed Divisions.
Horizontal Bar: Displays the bar meter horizontally.
Meter #: Indicates the individual meter whose characteristics are to be examined or edited. Meter 1 corresponds to the signal entering the top input connector tab, Meter 2 corresponds to the signal entering the second from the top input connector tab, and so on.
Axis Label: Indicates a name for the axis on which the signal is displayed. In a gauge display, the axis label is displayed horizontally across the top of the display; in a bar display, the axis label is displayed vertically along the left-hand side of the display.
Fixed Divisions: Indicates the number of grid ticks.
Upper and Lower Bound: Control the upper and lower bound of the meter display. The defaults are 1 and 0, respectively.
Style: Switches between bar and gauge display.
Window Title: Indicates a title for the meter block. The default is Meter.