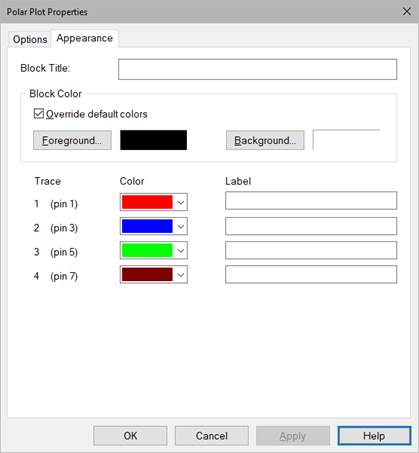
Background: Specifies the plotting area color.
Foreground: Specifies the axis labels and scaling text color.
Override Default Colors: Overrides the color specified in the View > Colors command.
Block Title: Provides a name for your polar plot. Titles can be up to 80 alphanumeric characters and appear title bar in the top area of the polar plot. By default, polar plots are titled Polar Plot.
Trace / Color / Label: Lets you specify a color and label for the input connector and corresponding signal trace in the polar plot.
Curve plot

Compass polar plot

Curve and compass polar plot
