 in the toolbar.
Before simulating the state chart, you can examine and set your simulation parameters using the Simulate > Simulation Properties command.
To simulate the state chart
•Choose Simulate > Go, or press  in the toolbar.
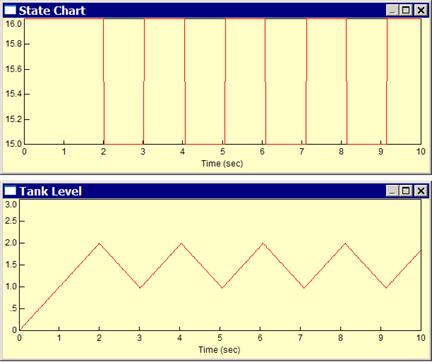
In the state chart, the active state is highlighted to show it is executing. In the top level Embed model, the two plots State Chart and Tank Level monitor the pump and the tank level, respectively.

Note: At the top level of the diagram, the button block wired into Tank Level Control must be turned ON.