You can activate a status bar and crosshairs in Bode plots to track and display data along the
frequency (x) and phase/magnitude (y) axes.
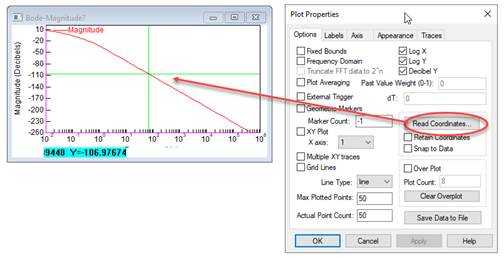
To activate the crosshairs and status bar
1. Right click over the Bode plot.
2. Under Options, click Read Coordinates.