User Interface Layout
View the main elements and terminology in the CADFEKOPOSTFEKOEDITFEKO graphical user interface (GUI).


-
- Quick access toolbar
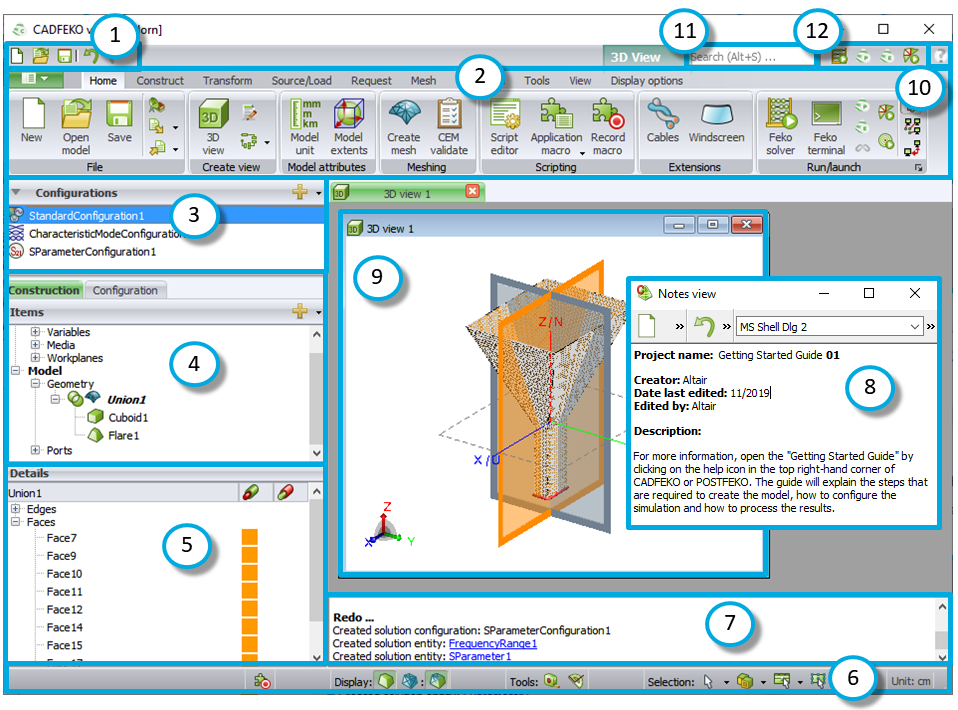
- The quick access toolbar is a small toolbar that gives quick access to actions that are performed often. The actions available on the quick access toolbar are also available via the ribbon. The quick access toolbar includes: NewNew project, OpenOpen project, SaveSave project, Undo and Redo.
-
- Ribbon
- The ribbon is a command bar that groups similar actions in a series of tabs. The ribbon consists of the application menu, core tabs and contextual tab sets.
-
- Configuration list
- The configuration list is a panel that displays all defined
configurations in the model. A new model starts by default with a single standard
configuration. The following configuration types are supported: Standard
configuration, Multiport S-parameter configuration and Characteristic modes
configuration.Tip: Multiple configurations allow you to perform efficient simulations using different configurations (different loads, sources, frequencies or power scaling) in a single model.
-
- Model tree
-
The model tree is a panel that organises the model-creation hierarchy and configuration-specific items of the model into two separate tabs at the top of the panel. A right-click context menu is available for all items in the model tree. Double-click on an item to open its properties.
Variables, media and named points are listed in both the Construction tab and the Configuration tab to provide quick access.
-
- Construction tab
- The Construction tab lists the model-creation
hierarchy in a tree format. Note: Select a geometry or mesh part on the Construction tab and in the details tree (5), modify its wire / edge / face / region properties, solution settings and custom mesh settings.
-
- Configuration tab
- The Configuration tab lists the
configuration-specific items in a tree format. Note: Select a configuration in the configuration list (3) and view its configuration-specific items in the Configuration tab.
-
-
- Details tree
- The details tree is a panel that displays the relevant wires, edges, faces and regions for the geometry or mesh part selected in the Construction tab (4). From the right-click context menu specify the properties for its wire, edge, face or region properties in the details tree. You can modify the selected item's local mesh size, material definition or coating or solution properties that are specific to the selection.
-
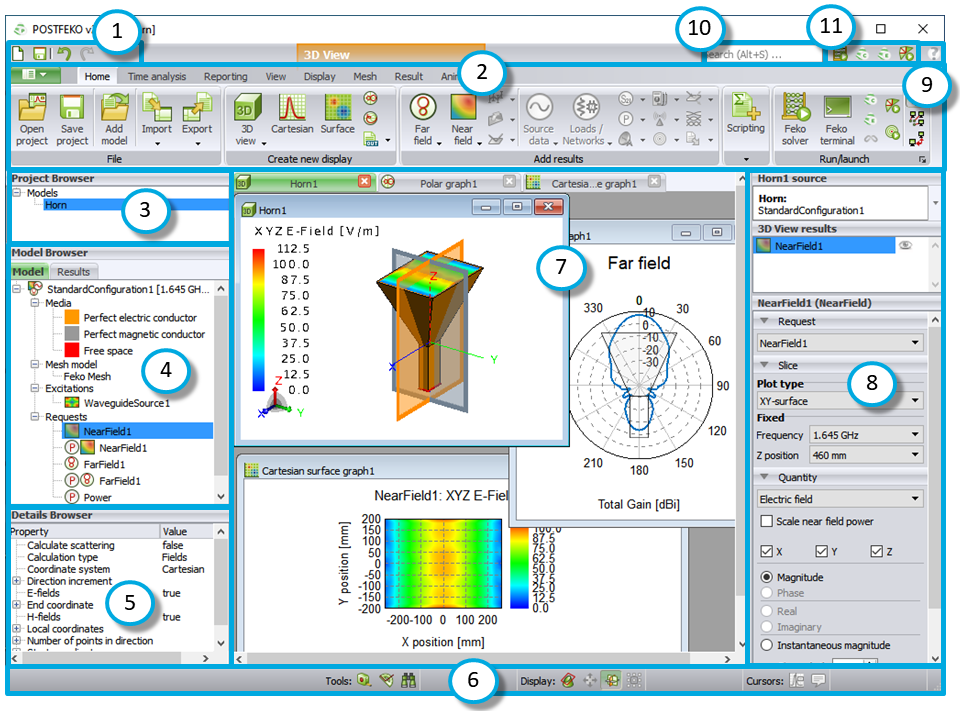
- Project browser
- The project browser is a panel that lists the models loaded in
the current project, imported data, stored data and scripted data.Tip: Collapse the project browser to expand the 3D view.
On the View tab, in the Show group, click the
 Project icon.
-
- Model browser
- The model browser is a panel that organises the model
information of the selected model in the project browser (6), into two separate tabs.
- Model tab
- The Model tab lists the model information and results for the selected model.
- Results tab
- The Results tab lists the results and solution information.
-
- Details browser
- The details browser is a panel that shows in-depth detail for
the selected item in the model browser (7).Tip: View the solution information for the selected model.On the model browser, click Solution information to view:
- memory per process
- total CPU-time
- total runtime.
-
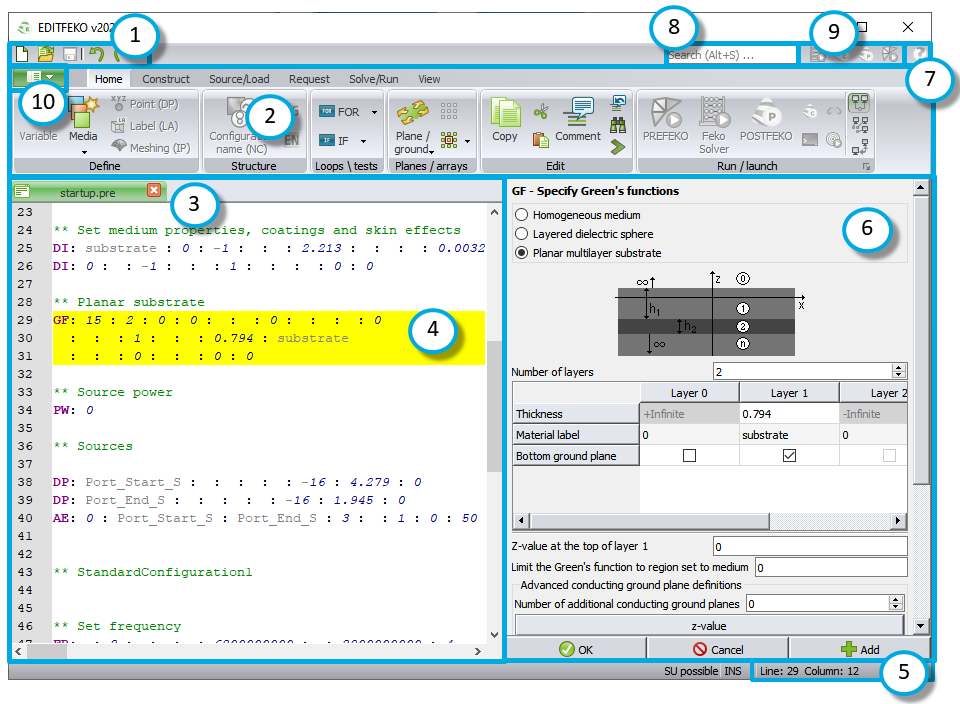
- Scripting editor area
- The scripting editor area is a window that displays opened
.pre files. Each .pre file is contained
in its own tab.Tip:
- Re-order the window tabs by simply dragging the tab to the desired location.
- View the path to the open .pre file by hovering with mouse cursor over the window tab.
- Supports file drag-and-drop functionality.
-
- Edit card
- Press F1 on a card to highlight the card entry in the scripting editor area and display the full card definition in the card panel (14).
-
- Status bar
- The status bar is a small toolbar that gives quick access to macro recording, general display settings, tools, selection method and type, snap settings and the model unit.
-
- Status bar
- The status bar is a small toolbar that gives quick access to general display settings, tools, and graph cursor settings.
-
- Status bar
- The status bar is a small toolbar that shows the line and column number for the current cursor position as well as the setting for the text editor (insert or overwrite).
-
- Card panel
- The card panel is the panel that contains the full card definition.Tip:
- Click the OK button to add the card to the .pre file and close the card panel.
- Click the Add button to add the card to the .pre file, but keep the card panel open.
-
- Message window
- The message window is a panel that displays general information as well as error and warning messages. Error and warning messages include links to the relevant wires, edges, faces or regions that resulted in the warning or error.
-
- Notes view
- The notes view is a window where you can document model
details. Add additional comments or information for future reference.Tip: The notes view is hidden by default, but can be enabled.
On the Home tab, in the Create view group, click the
 Notes
icon.
-
- 3D view
- The 3D view window displays the geometry and mesh as well as solution requests (for example, a far field request).
-
- 3D view/2D graphs
-
- 3D view
- The 3D view displays the geometry, mesh, solution settings as well as 3D results.
- 2D graphs
- The 2D graphs display the 2D results on either a Cartesian graph, polar graph, Smith chart or Cartesian surface graph.
-
- Result palette
- The result palette is a panel that gives access to options that control the data in the 3D view or 2D graph for the relevant result type. For example, 3D far field data allows the phi cut plot type and gain in dB to be specified.
-
- Help
- The Help icon gives quick access to the Feko manuals.Tip: Press F1 to access context sensitive help.
-
- Search bar
- The search bar is a single-line textbox that allows you to enter a keyword and search for relevant information in the GUI. Entering a keyword in the search bar will populate a drop-down list of actions as well as the location of the particular action on the ribbon or context menu. Clicking on an item in the list will execute the action.
-
- Application launcher
- The application launcher toolbar is a small toolbar that gives quick access to other Feko components.