HS-1020: Work with a Parameterized File Model for Size Variables
Learn how to create a template file for size variables, and how to import them to
HyperStudy.
Before you begin, copy the model files used in
this tutorial from <hst.zip>/HS-1020/ to your working
directory.
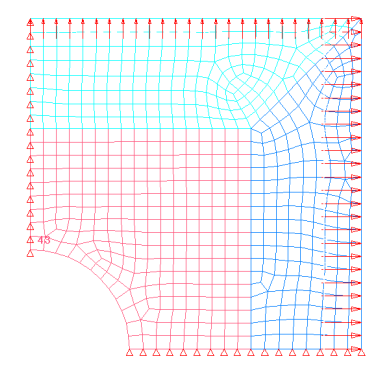
The design variables are the thickness of each of the three components, defined in
the input deck via the PSHELL card. The thickness should be between 0.05 and 0.15;
the initial thickness is 0.1. Figure 1. Double Symmetric Plate Model
Perform the Study Setup
Start HyperStudy.
Start a new study in the following ways:
From the menu bar, click File > New.
On the ribbon, click .
In the Add Study dialog, enter a study name, select a
location for the study, and click OK.
Go to the Define Models step.
Add a Parameterized File model.
Click Add Model.
In the Add dialog, select Parameterized
File and click OK.
Define the Parameterized File model.
In the work area, Resource column, click .
In the Open File dialog, open the
plate.fem file.
An Altair HyperStudy™ dialog opens,
informing you that there are no parameters found in the
file.
Click Yes to parameterize the file.
The plate.fem file opens as a
.tpl file in the
Editor.
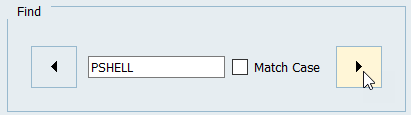
In the Find area, enter PSHELL and click three
times.
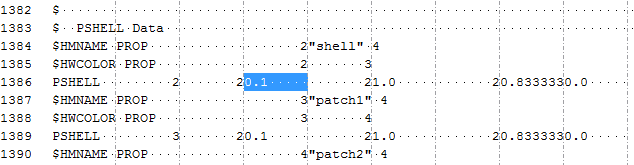
Three PSHELL cards, containing the shell thickness of each
component in the fourth field, are highlighted. Each field is eight
characters long. The numbers need to be replaced with formatted Templex statements to mark a design
variable. Figure 2.
Starting at 0.1, highlight the first eight fields for thickness.
Tip: Quickly highlight 8-character fields by pressing
CTRL to activate the Selector (set to 8
characters) and then clicking the value.
Figure 3.
Right-click on the highlighted fields and select Create
Parameter from the context menu.
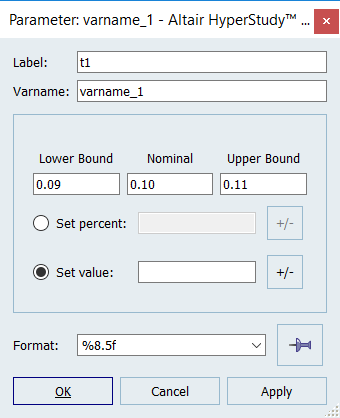
In the Parameter: varname_1 dialog, enter the
following values and click OK
In the Label field, enter t1.
In the Format field, enter %8.5f.
Figure 4.
Click OK to close the
Editor.
In the Save Template dialog, save the template
file as plate.tpl.
HyperStudy automatically populates the Resource
column with the plate.tpl file and the Solver input
file column with the solver input file name
plate.fem.
In the Solver execution script column, select OptiStruct
(os).
Click Import Variables.
One design variables is imported from the plate.tpl
resource file.
Go to the Define Input Variables step.
Review the design variable's lower and upper bound ranges.
Perform Nominal Run
Go to the Test Models step.
Click Run Definition.
An approaches/setup_1-def/ directory is created
inside the study Directory. The
approaches/setup_1-def/run__00001/m_1 directory
contains the input file, which is the result of the nominal run.
Create and Evaluate Output Responses
In this step you will create output responses, Mass and Displacement.
Go to the Define Output Responses step.
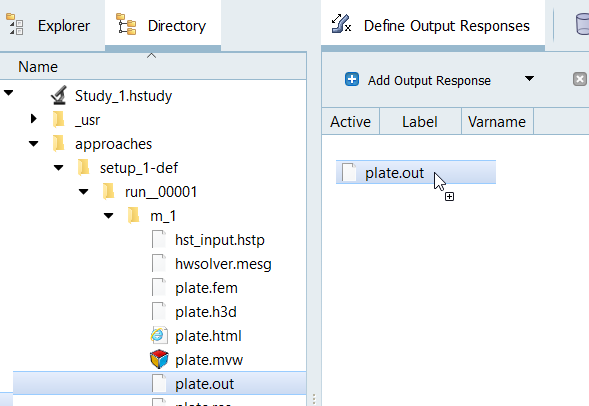
Create the Mass output response.
From the Directory, drag-and-drop the plate.out
file, located in
approaches/setup_1-def/run__00001/m_1, into the
work area.
Figure 5.
In the File Assistant dialog, set the Reading
technology to Altair® HyperWorks® and click
Next.
Select Single Item in a Time Series, then click
Next.
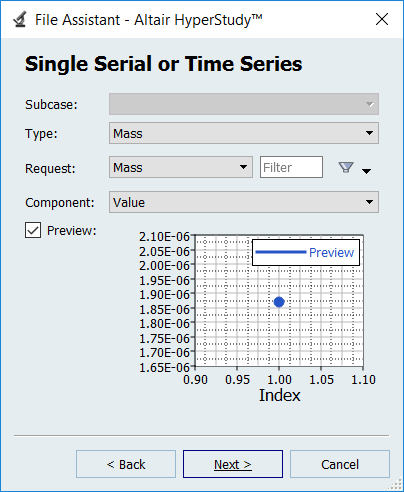
Define the following options, then click Next.
Set Type to Mass.
Set Request to Mass.
Set Component to Value.
Figure 6.
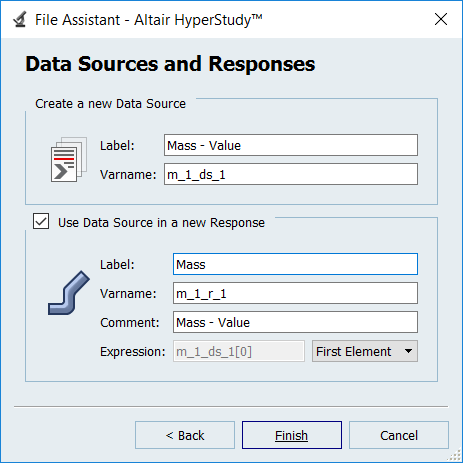
Label the output response Mass.
Set Expression to First Element.
Note: Because there is only a single value in this data source, [0] is
inserted after m_1_ds_1, thereby choosing the first (and only) entry
in the data source.
Click Finish.
Figure 7.
The Mass output response is displayed in the work area.
Create the Displacement output response.
From the Directory, drag-and-drop the
plate.h3d file, located in
approaches/setup_1-def/run__00001/m_1, into the work area.
In the File Assistant dialog, set the Reading
technology to Altair® HyperWorks® and click
Next.
Select Single Item in a Time Series, then click
Next.
Define the following options, and then click Next.
Set Subcase to Subcase 1 (Load).
Set Type to Displacement (Grids).
Set Request to N298.
Set Component to MAG.
Label the output response Displacement.
Set Expression to First Element.
Click Finish.
The Displacement output response is added to the work area.
 .
. .
.
 three
times.
Three PSHELL cards, containing the shell thickness of each component in the fourth field, are highlighted. Each field is eight characters long. The numbers need to be replaced with formatted Templex statements to mark a design variable.
three
times.
Three PSHELL cards, containing the shell thickness of each component in the fourth field, are highlighted. Each field is eight characters long. The numbers need to be replaced with formatted Templex statements to mark a design variable.