HS-1060: Link Variables of a Model to Output Responses of Other Models
Learn how to link variables of a model to output responses of other models.
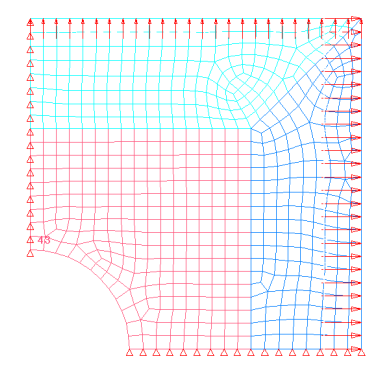
Figure 1. Double Symmetric Plate Model
Perform the Study Setup
-
Start a new study in the following ways:
- From the menu bar, click .
- On the ribbon, click
 .
.
-
Add a Parameterized File model.
-
From the Directory, drag-and-drop the plate.tpl
file into the work area.
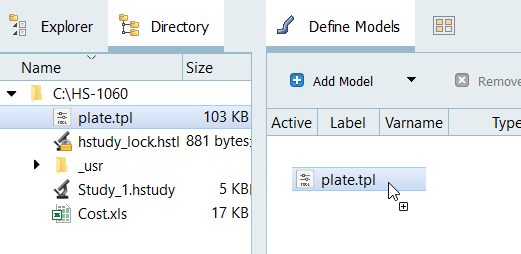
Figure 2.
-
From the Directory, drag-and-drop the plate.tpl
file into the work area.
-
Add a Spreadsheet model by dragging-and-dropping Cost.xls
file from the Directory into the work area.
The Resource, Solver input file, and Solver input arguments fields become populated. The Solver input file field displays hst_input.hstp, this is the name of the solver input file HyperStudy writes during an evaluation.Note:
When you create an Excel spreadsheet model, it is important that the spreadsheet is formatted correctly. A variable's value and label can be formatted in two consecutive rows or two consecutive columns. Variable labels should only contain English characters, or a combination of English characters and numbers. If a label is not created for a variable, HyperStudy will assign one by default.

Figure 3. -
Add input variables.
-
In the spreadsheet, select the cells that contain the input variable's
labels and values.
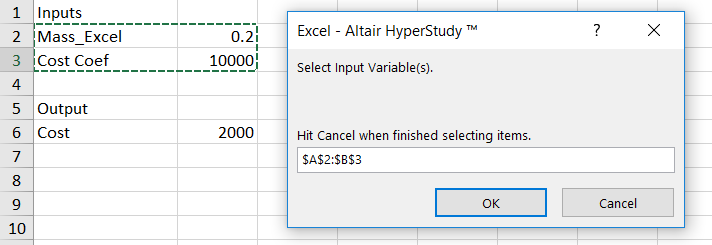
Figure 4.
-
In the spreadsheet, select the cells that contain the input variable's
labels and values.
-
Add output responses.
-
In the spreadsheet, select the cells that contain the output response's
label and value.
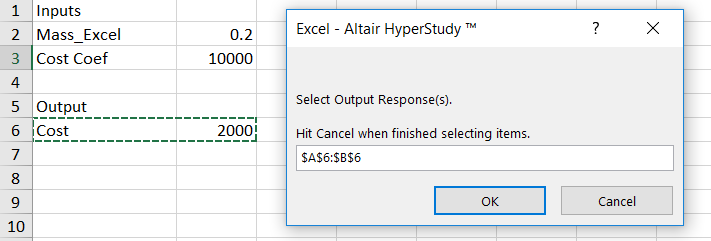
Figure 5.
-
In the spreadsheet, select the cells that contain the output response's
label and value.
Perform Nominal Run
Create and Evaluate Output Responses
In this step you will create output responses, Mass and Displacement.
-
Create the Mass output response.
-
From the Directory, drag-and-drop the plate.out
file, located in
approaches/setup_1-def/run__00001/m_1, into the
work area.
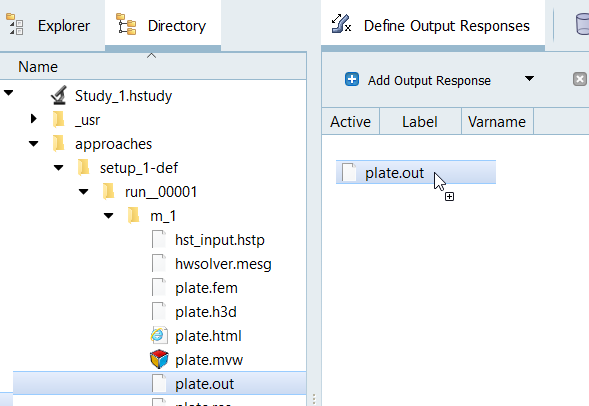
Figure 6. -
Define the following options, then click Next.
- Set Type to Mass.
- Set Request to Mass.
- Set Component to Value.
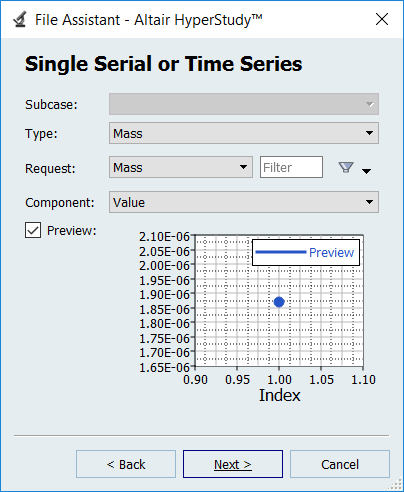
Figure 7. -
Click Finish.
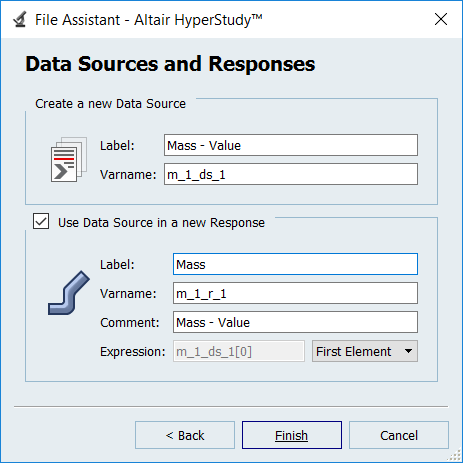
Figure 8.
The Mass output response is displayed in the work area. -
From the Directory, drag-and-drop the plate.out
file, located in
approaches/setup_1-def/run__00001/m_1, into the
work area.
Link Input Variables to Output Responses
In this step you will link Mass_Excel input variable of Model 2 to Mass output response of Model 1.
-
In the Expression column of the input variable Mass_Excel, click
 .
.
-
Click OK.
The input variable Mass_Excel of Model 2 is now linked to the output response Mass of Model 1.
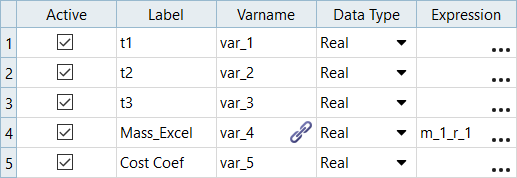
Figure 9. -
Perform a System Bounds Check and verify that the input variable Mass_Excel is
equal to the output response Mass.
-
Click the Evaluation Data tab and verify that
the input variable Mass_Excel is equal to the output response
Mass.
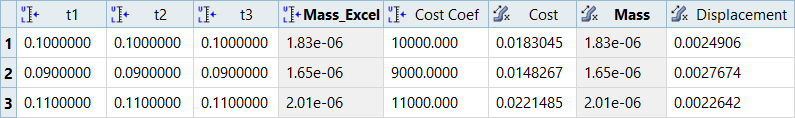
Figure 10.
-
Click the Evaluation Data tab and verify that
the input variable Mass_Excel is equal to the output response
Mass.