HS-1700: Simple DOE Study
Learn how to set up a DOE study on simple functions defined using a Templex template.
Before you begin, complete HS-1010: Set Up a Simple Study or import the HS-1010.hstx archive
file, available in <hst.zip>/HS-1700/.
Run DOE
-
Click the Levels tab, and change the number of levels
from 2 to 3.
This change will spread the levels between the lower and upper bounds.
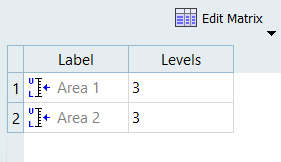
Figure 1.
Post Process Results
In this step you will review the effects and interaction between both input variables and output responses.
-
Review linear effects.
- Click the Linear Effects tab.
-
Above the Channel selector, click
 to
plot the linear effects.
to
plot the linear effects.
- Using the Channel selector, select both input variables and output responses.
- Review the effects of Area 1 and Area 2 on Response 1 and Response 2.
You can observe that the effects of Area 1 and Area 2 on Response 1 are the same (proportional with a magnitude 4.8). From the second plot, you can observe that the effects of Area 1 and Area 2 on Response 2 are also the same (inversely proportional with a magnitude -4.8). For information on how to calculate the magnitude in DOE refer to Setup DOE Studies.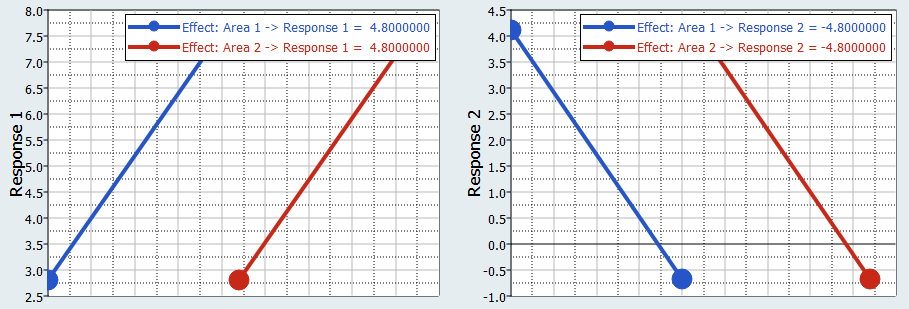
Figure 2. -
Review interactions.
-
Review the interactions between Area 1 and Area 2 on Response 1 and
Response 2.
From both plots, you can observe that there is no interaction between Area 1 and Area 2 for both Response 1 and Response 2.
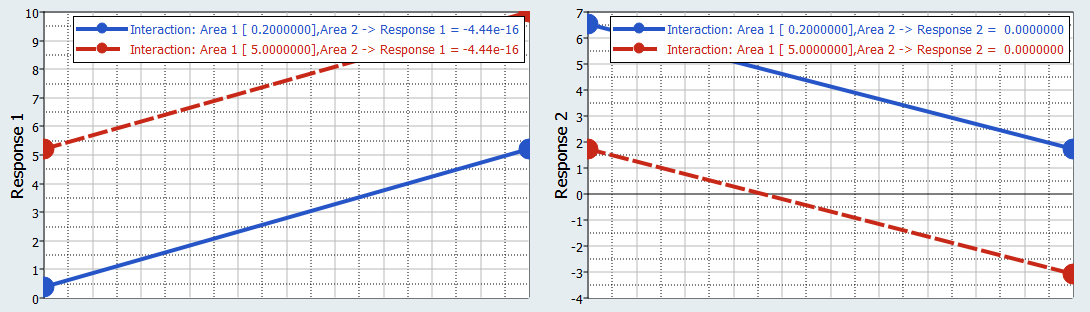
Figure 3.
-
Review the interactions between Area 1 and Area 2 on Response 1 and
Response 2.