HS-2201: Use Existing Design Data from an Excel Spreadsheet with a Lookup Model
Learn how to perform an optimization study for an application where only design data in a .csv file is available (that is no simulation model exists).
Before you begin, copy the model files used in
this tutorial from <hst.zip>/HS-2201/ to your working
directory.
The objective of this tutorial is to create a fit (approximation) using the designs in the study_data.csv file and then to perform an optimization study using the fit.
The first and second columns contain the values of the two input variables for each design, and the third and fourth columns contain the results of a DOE study previously run. Sixteen designs have been evaluated.
Perform the Study Setup
-
Start a new study in the following ways:
- From the menu bar, click .
- On the ribbon, click
 .
.
-
Add a Lookup model.
- Click Add Model.
- In the Add dialog, select Lookup and click OK.
-
In the work area, Resource column, click
 .
.
- In the HyperStudy – Load model resource dialog, navigate to your working directory and open the study_data.csv file.
-
Import variables.
- Click Import Variables.
- In the Import Variables dialog, Number of design variables field, enter 2.
- Click OK.
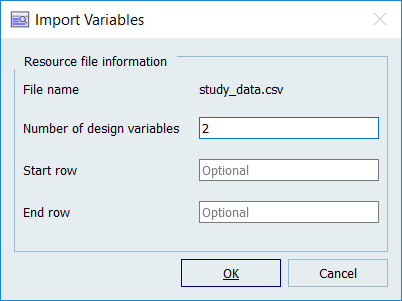
Figure 1. -
Review the two input variables that were imported from the
study_data.csv file.

Figure 2.
Perform Nominal Run
Review Output Responses
-
Review the two output responses that were imported from the
study.csv file.

Figure 3.
Import DOE Results from CSV
-
From the Settings tab, Matrix File field, click .
-
In the Open dialog, navigate to your working directory and
open the study_data.csv file.
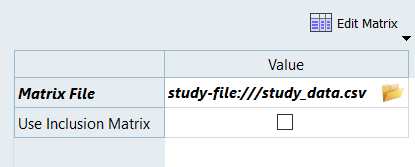
Figure 4.
Run Fit
-
Define specifications.
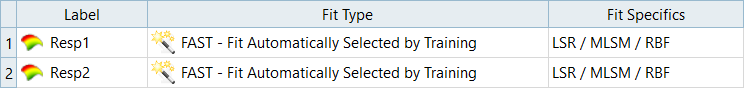
Figure 5. -
Click the Diagnostics tab.
Resp1 has the best Fit using LSR with custom terms; the Regression Terms tab shows that only linear terms are required. Resp2 has the best results using a MLSM. For Resp2, the R-square value that is based on the Input Matrix shows that the model accuracy is very good. The moderate value for the cross validation indicates that the model may benefit from more data because its accuracy is quite dependent on the complete set of point. Removing any points from the input set can significantly alter the Fit’s predictions.
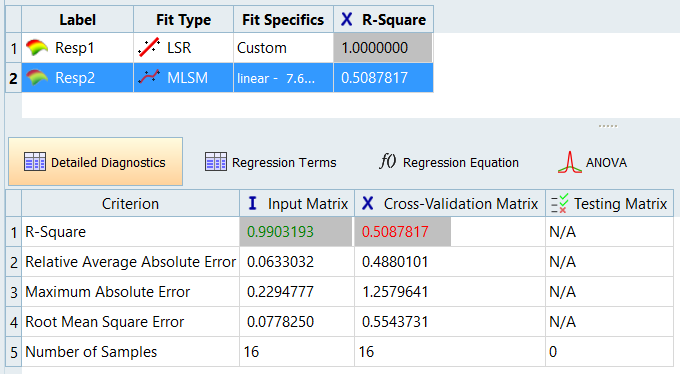
Figure 6.