HWD-0035: Report Parameters
- Generate report parameter templates.
Tools
The Parameters Browser allows you to customize and automate the repeatable process of generating entire analysis sessions in HyperWorks Desktop. The reality of automation is that it's not always desirable to re-apply automation scripts exactly as they were originally defined. To remedy this, the Parameters Browser includes a graphical user interface for defining parameters that can be changed when an automation script is executed. To display the browser, select from the menu bar.
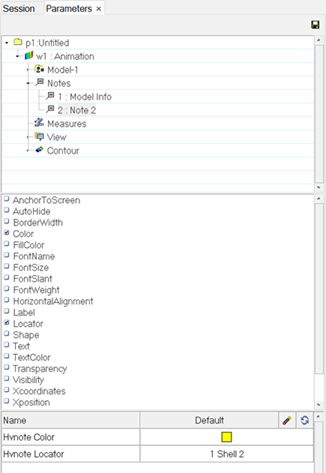
Figure 1.
After the parameters are defined, you can save the automation script and run it from the Flexible Report Templates panel.
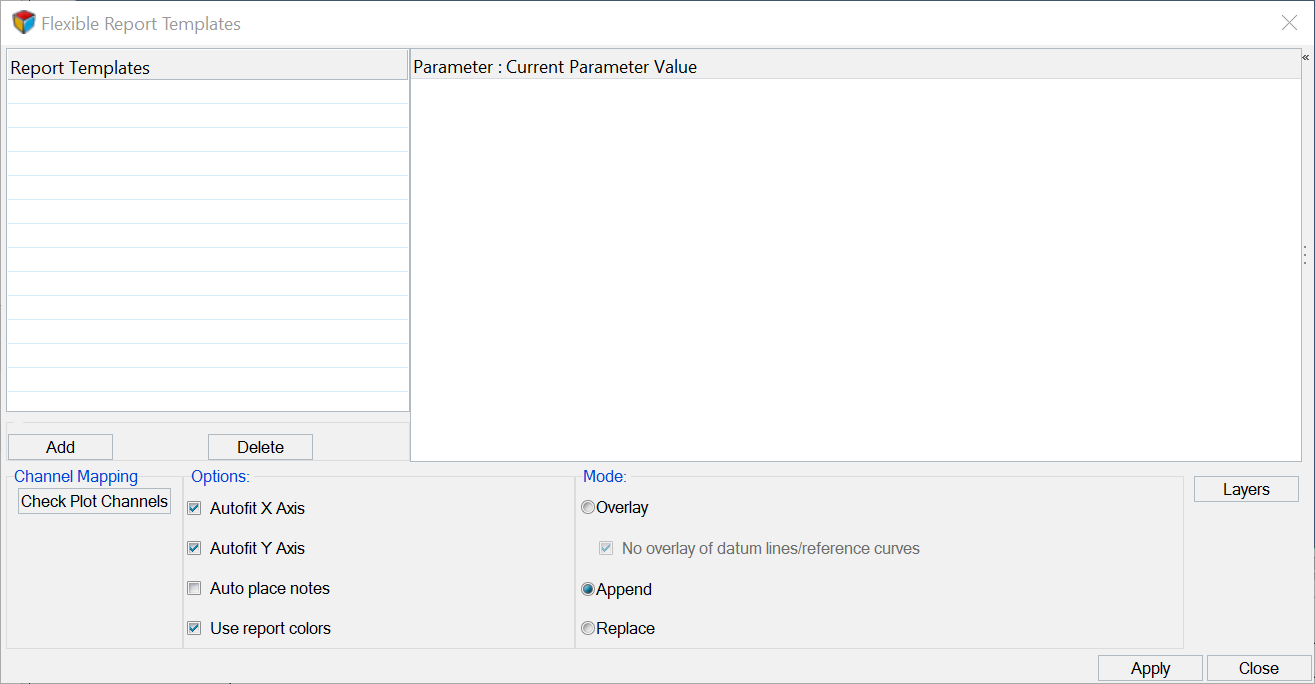
Figure 2.
This exercise, Using the Parameters Browser, uses the model file, d3plot, for the model and results.
Loading and Contouring the Model
-
Select the Contour panel from the toolbar,
 .
.
-
Click Start/Pause Animation,
 , to start the animation.
-
Click Animation Controls,
 , to open the panel.
-
Use the Current Time slider to set the current time 0.03.
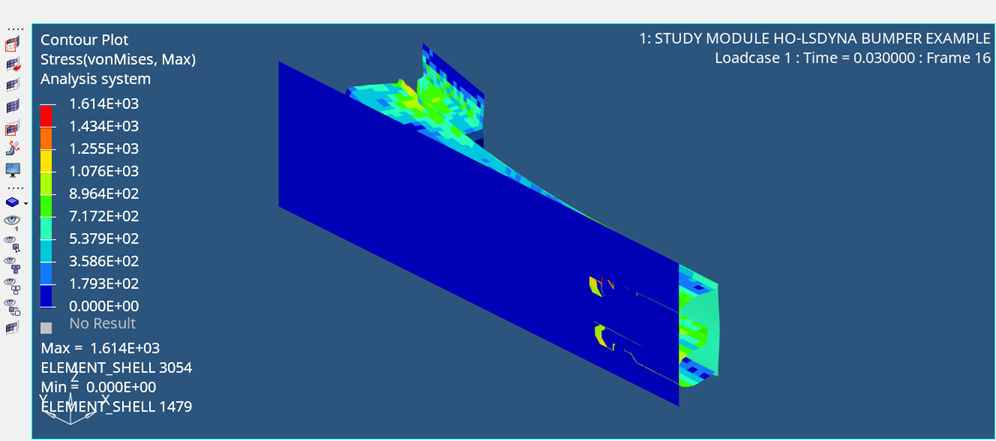
Figure 3.
Create a Note on the Model
-
Click the Note icon,
 , to open the panel.
-
Select Entity contour max val and click
Insert Field.
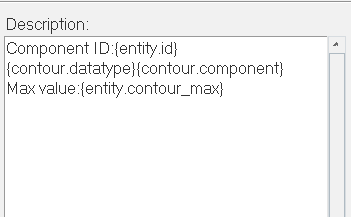
Figure 4. -
Click Apply to create the note.
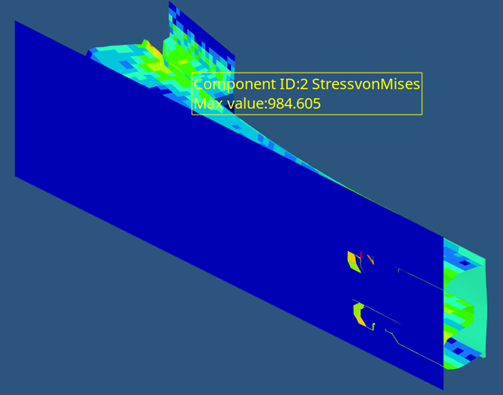
Figure 5.
Saving the Parameters
-
Place check marks next to Color and Locator.
Figure 6. -
Click the Save icon in the Parameters Browser.
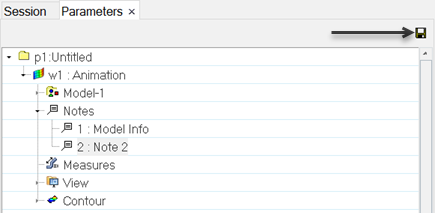
Figure 7.
Importing the Report Parameters
-
Click the Open Reports Panel icon,
 , to open the dialog.
The .tpl should be loaded in the dialog.
, to open the dialog.
The .tpl should be loaded in the dialog. -
Click Apply to apply the changes.
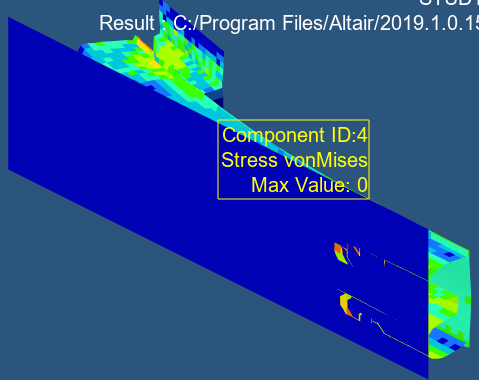
Figure 8.The bumper results are displayed with the note attached to Component 4.
Using the Report Definition to Add Further Views
-
Click Apply to add the new report.
Figure 9.Notice a second page is added with results and new note for Component 5.
-
Click Apply.
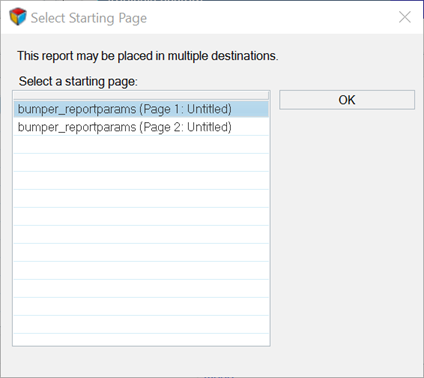
Figure 10. -
Change to page 1.
Notice the note is appended to the page selected.
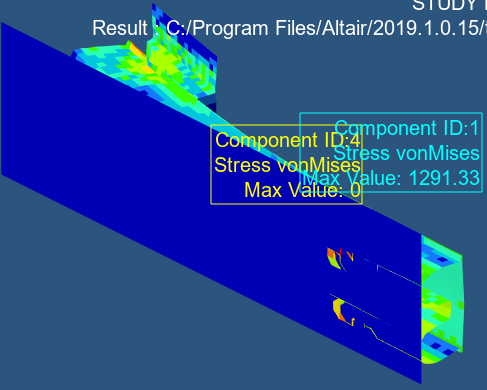
Figure 11. -
Click the Files View icon,
 , in the HyperView
Results Browser.
, in the HyperView
Results Browser.
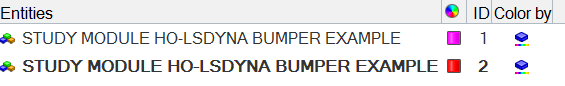
Figure 12.Notice there are two models in the Files section.
-
Right-click on the first model in the list and click
Hide.
The model is hidden from view, revealing the contoured model.
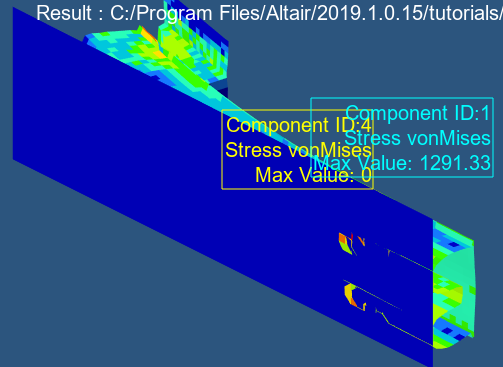
Figure 13.