Plot Graph (Compare Analytical and OptiStruct Results)
Plot the comparative graph using Altair Compose.
It is not possible to plot the graph directly from the OptiStruct results, a script to plot the graph is used.
Altair Compose is a scripting environment by Altair Simulation. A script is written in Compose to plot the graph of Frequency versus Transmission Loss to show the comparison between them. In the graph (図 1) of Frequency versus Transmission Loss for both the methods, you can see that results obtained by OptiStruct agree with those calculated by the Analytical Method.
To run the Compose script:
-
In the point selection popup, for Point 1, select any point, except Point ID
171, (for example, Point ID 33). For Point 3, select Point ID 171.
Compose will run the script and output the 'Frequency versus Transmission Loss' graph.
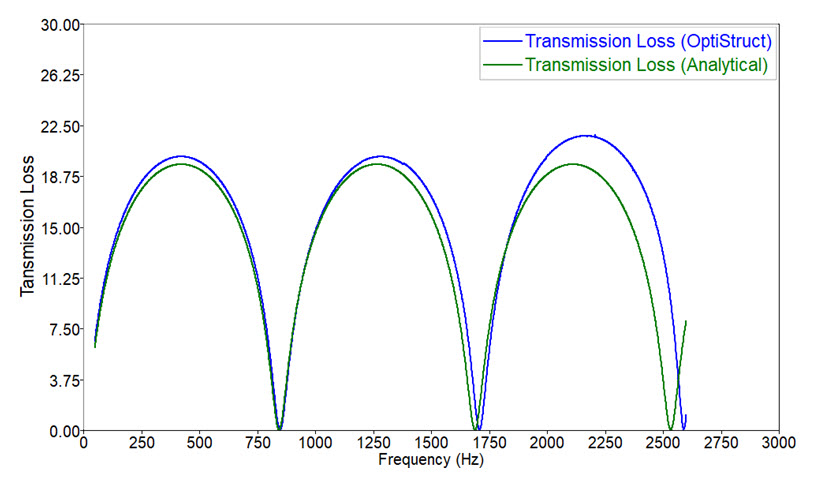
図 1. Frequency versus Transmission Loss Plot