OS-E: 0315 Design Sensitivity Analysis
Demonstrates how to identify sensitive design parameters within a full vehicle NVH model, both as a way to understand the dynamics of the system and what design changes can be made to improve a vehicle response, using OptiStruct and NVH post-processing in HyperView.
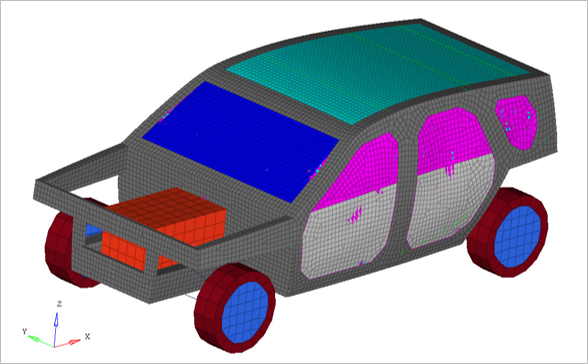
Figure 1. FE Model
Model Files
Refer to Access the Model Files to download the required model file(s).
The model file used in this example includes:
DSA_ALTAIRCAR.fem
Model Description
To define DSA request for frequency response analysis:
DSA (TYPE, SCALE) = SID
- TYPE
- DISP
- SCALE
- Flag indicating what the sensitivities are:
- SID
- A GRIDC set
- FE Model
- Element Types
- CBUSH
- MAT1
- Young’s Modulus
- 30E6 MPA
- Poisson's Ratio
- 0.3
Results
Once the design variables are identified in the .h3d file based on DESVAR card, plot:
Magnitude and Vector based linear projection results can be compared which is DSA global, with the former giving the conventional result, while the latter being more conservative.
Bar Chart is the primary way to visualize design variable has the highest sensitivities. The complex design sensitivities can be presented in relation to the response phase in two different ways: Magnitude or Projected sensitivity
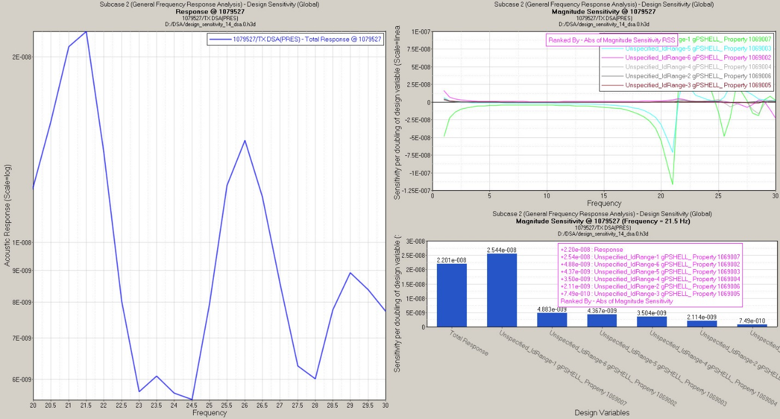
Figure 2. DSA Plots from the NVH Utilities