OS-E: 0605 One Step Thermal Transient Stress Analysis
Demonstrates One Step Thermal Transient Stress Analysis using an exhaust manifold.
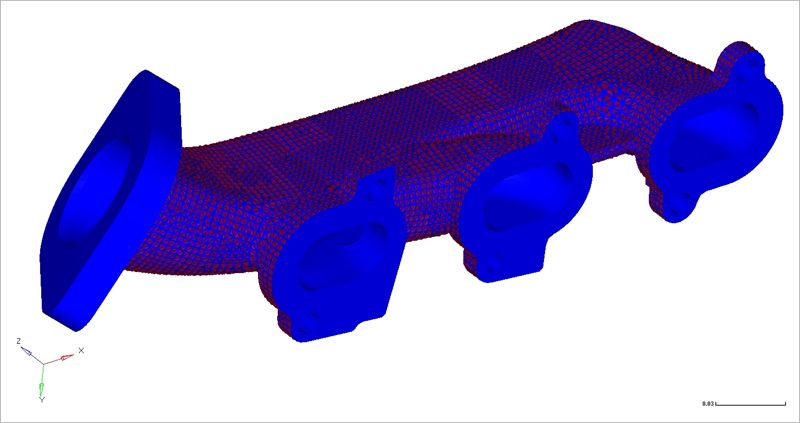
Figure 1. FE Model
Model Files
Refer to Access the Model Files to download the required model file(s).
The model file used in this example includes:
OSTTS_MANIFOLD.fem
Model Description
An engine exhaust manifold with conjugate heat transfer and structural deformation, constructed of gray cast iron, initially at 300 K. The manifold outer surface has a convective heat transfer coefficient of h = 6 W/m2 K at 300 K. The four inlets to the manifold are held at 500 K with air as the fluid at 5 m/s.
Temperature history is available after linear transient heat transfer analysis. In order to apply temperatures at multiple time steps to a structural analysis, one step transient thermal stress analysis should be used. It provides displacement and stress history for the duration of transient heat transfer.
- FE Model
- Element Types
- CTETRA
- Property
- Value
- Young’s Modulus
- 1.38E11 PA
- Poisson's Ratio
- 0.283
- Initial Density
- 7817 Kg/m3
Stress versus Strain curve defined for MATS1 (for NLSTAT analysis only).
Results
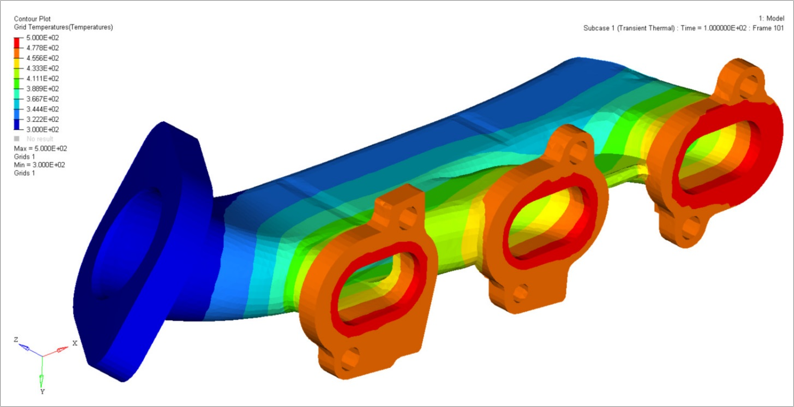
Figure 2. Grid Temperature Contour from Subcase 1
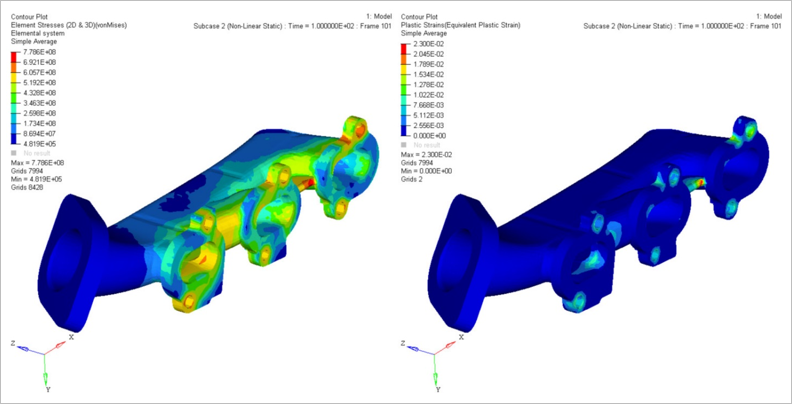
Figure 3. Element Stress and Plastic Strain form Subcase 2
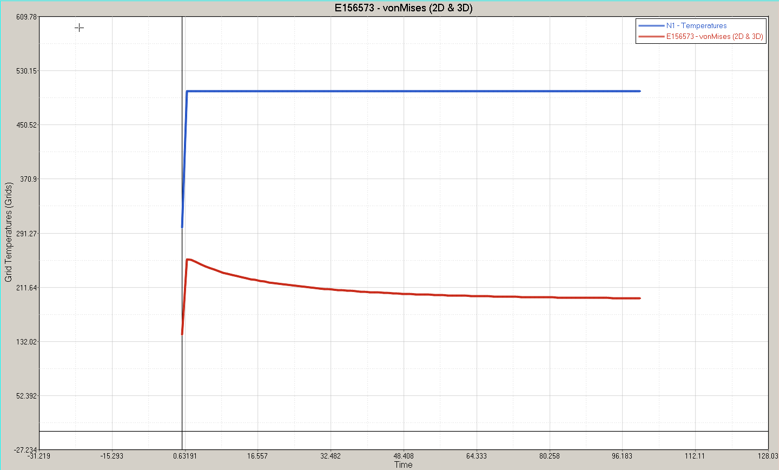
Figure 4. Stress and Temperature versus Time (Stress scaled to 1e-6)