.#.rnf file
The .#.rnf is an OptiStruct ASCII format results file.
File Creation
This file is created when the OPTI format is chosen on or in conjunction with RNFLOW I/O Options Entry for Fatigue Analysis. The # is the corresponding Fatigue subcase ID and separate .rnf files are created for multiple Fatigue Subcases (Refer to I/O Options RNFLOW, FORMAT and OUTPUT).
File Contents
This file contains Rainflow Cycle count history for each Fatigue subcase. The information is printed as a separate table for each element in the model (for RNFLOW=ALL) or separate tables for each element in the selected element set (for RNFLOW=SID). The printed tables vary in content depending on the type of Fatigue solution being run. Currently, .rnf file output is supported for Static, Transient, Sine-Sweep, and Random Response Fatigue analyses.
Static Analysis
For Static Analysis, the printed tables are different depending on if SN or EN Fatigue is being conducted.

Figure 1. Example: Table for Static Analysis (SN)
- Element ID
- The header at the top of the table consists of the Element ID of consideration.
- Event ID
- The first line under Element header indicates the ID of the FATEVNT Bulk Data Entry and in parentheses lists the counter of the current FATEVNT under consideration out of the total number of FATEVNT entries.
- Number of Cycles
- Number of Rainflow cycles detected for the current Element in the current FATEVNT.
- Cycle ID
- Rainflow Cycle ID
- Stress Amplitude
- Stress ampitude of the current Cycle
- Mean Stress
- Mean stress of the current Cycle
- Damage
- Damage value of the current Cycle
- TABFAT_pt1
- First point of the load time history for the current cycle
- TABFAT_pt2
- Second point of the load time history for the current cycle
Example: Table for Static Analysis (EN)
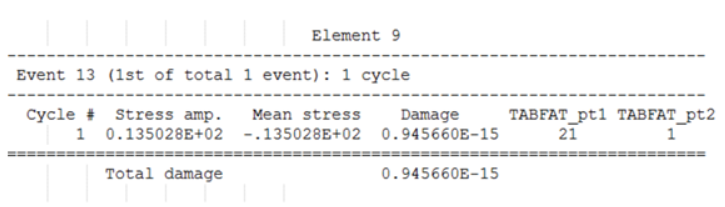
Figure 2. EN Static Fatigue (SWT)
Figure 3. EN Static Fatigue (MORROW)
- Element ID
- The header at the top of the table consists of the Element ID of consideration.
- Event ID
- The first line under Element header indicates the ID of the FATEVNT Bulk Data Entry and in parentheses lists the counter of the current FATEVNT under consideration out of the total number of FATEVNT entries.
- Number of Cycles
- Number of Rainflow cycles detected for the current Element in the current FATEVNT.
- Cycle ID
- Rainflow Cycle ID
- Strain Amplitude
- Strain ampitude of the current Cycle
- Max Stress (SWT)
- Max stress of the current Cycle
- Mean Stress (MORROW)
- Mean stress of the current Cycle
- Damage
- Damage value of the current Cycle
- TABFAT_pt1
- First point of the load time history for the current cycle
- TABFAT_pt2
- Second point of the load time history for the current cycle
Sine Sweep Fatigue Analysis
For Sine Sweep Fatigue Analysis, the printed tables are different depending on if SN or EN Fatigue is conducted.
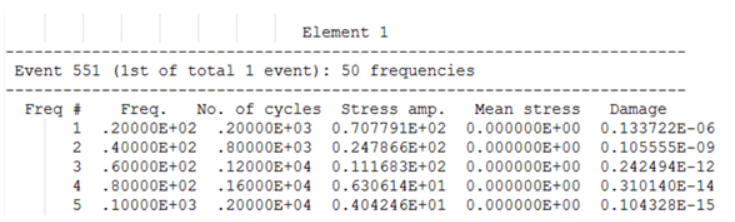
Figure 4. Example: Table for Sine Sweep Fatigue Analysis (SN)
- Element ID
- The header at the top of the table consists of the Element ID of consideration.
- Event ID
- The first line under Element header indicates the ID of the FATEVNT Bulk Data Entry and in parentheses lists the counter of the current FATEVNT under consideration out of the total number of FATEVNT entries.
- Number of Frequencies
- Number of Frequencies in Sine Sweep Fatigue Analysis for the current subcase.
- Freq ID
- Number/ID of the current frequency of interest in the table
- Number of Cycles
- Number of cycles of the particular frequency of interest
- Stress Amplitude
- Stress ampitude of each Cycle at the current frequency
- Mean Stress
- Mean stress of each Cycle at the current frequency
- Damage
- Cumulative damage value of the current Cycle at the current frequency
Example: Table for Sine Sweep Fatigue Analysis (EN)
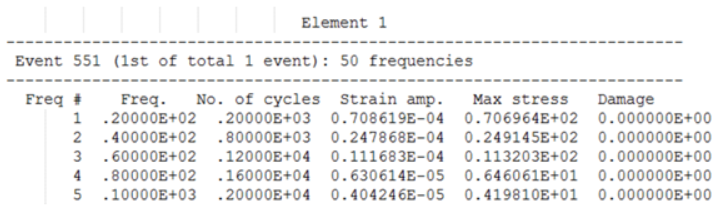
Figure 5. EN Sine Sweep Fatigue (SWT)
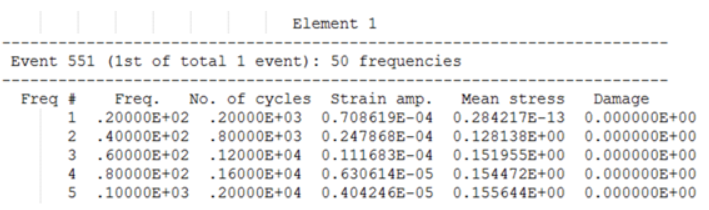
Figure 6. EN Sine Sweep Fatigue (MORROW)
- Element ID
- The header at the top of the table consists of the Element ID of consideration.
- Event ID
- The first line under Element header indicates the ID of the FATEVNT Bulk Data Entry and in parentheses lists the counter of the current FATEVNT under consideration out of the total number of FATEVNT entries.
- Number of Frequencies
- Number of Frequencies in Sine Sweep Fatigue Analysis for the current subcase.
- Freq ID
- Number/ID of the current frequency of interest in the table
- Number of Cycles
- Number of cycles of the particular frequency of interest
- Strain Amplitude
- Strain ampitude of each Cycle at the current frequency
- Max Stress (SWT)
- Max stress among all Cycles at the current frequency
- Mean Stress (MORROW)
- Mean stress of all Cycle at the current frequency
- Damage
- Damage value of the worst damage Cycle at the current frequency
Random Response Fatigue Analysis
For Random Response Fatigue Analysis, the printed tables are different depending on if SN or EN Fatigue is conducted.
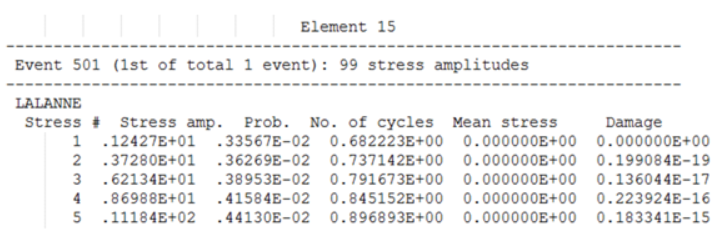
Figure 7. Example: Table for Random Response Fatigue Analysis (SN)
- Element ID
- The header at the top of the table consists of the Element ID of consideration.
- Event ID
- The first line under Element header indicates the ID of the FATEVNT Bulk Data Entry and in parentheses lists the counter of the current FATEVNT under consideration out of the total number of FATEVNT entries.
- Number of Stress Amplitudes
- Number of Stress Amplitudues in Random Response fatigue analysis for the current subcase.
- DIRLIK/LALANNE/NARROW/THREE
- Random Response Damage model used
- Stress ID
- Number/ID of the current stress amplitude of interest in the table
- Prob
- Probability of occurrence of the corresponding stress amplitude
- Number of Cycles
- Number of cycles of the particular stress amplitude
- Mean Stress
- Mean stress of each Cycle at the current stress amplitude
- Damage
- Cumulative damage value of all Cycles at the current stress amplitude
Example: Table for Random Response Fatigue Analysis (EN)
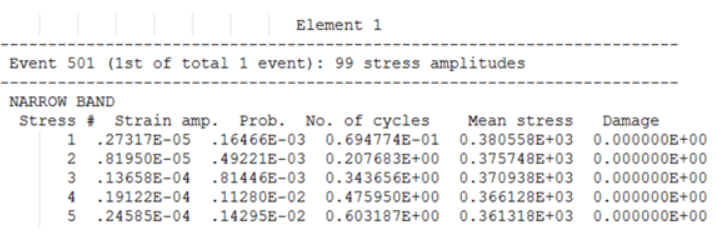
Figure 8. EN Random Response Fatigue (SWT)
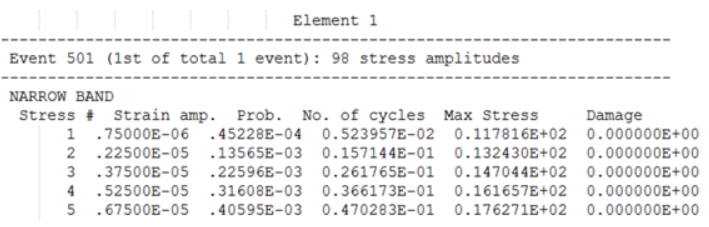
Figure 9. EN Random Response Fatigue (MORROW)
- Element ID
- The header at the top of the table consists of the Element ID of consideration.
- Event ID
- The first line under Element header indicates the ID of the FATEVNT Bulk Data Entry and in parentheses lists the counter of the current FATEVNT under consideration out of the total number of FATEVNT entries.
- Number of Strain Amplitudes
- Number of Strain Amplitudues in Random Response fatigue analysis for the current subcase.
- DIRLIK/LALANNE/NARROW/THREE
- Random Response Damage model used
- Strain ID
- Number/ID of the current strain amplitude of interest in the table
- Prob
- Probability of occurrence of the corresponding strain amplitude
- Number of Cycles
- Number of cycles of the particular strain amplitude
- Mean Stress (SWT)
- Mean stress of each Cycle at the current strain amplitude
- Max Stress (MORROW)
- Max stress of each Cycle at the current strain amplitude
- Damage
- Cumulative damage value of all Cycles at the current strain amplitude
Multiaxial Fatigue Analysis
For Multiaxial Analysis, the printed tables are different depending on if SN or EN Fatigue is being conducted.
Example: Table for Static Analysis (SN)
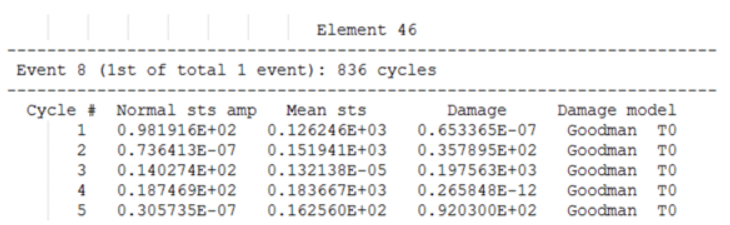
Figure 10. Goodman Damage Model
- Element ID
- The header at the top of the table consists of the Element ID of consideration.
- Event ID
- The first line under Element header indicates the ID of the FATEVNT Bulk Data Entry and in parentheses lists the counter of the current FATEVNT under consideration out of the total number of FATEVNT entries.
- Number of Cycles
- Number of Rainflow cycles detected for the current Element in the current FATEVNT.
- Cycle ID
- Rainflow Cycle ID
- Normal Stress Amplitude
- Stress ampitude of Normal Stress for the current Cycle
- Mean Stress
- Mean stress of the current Cycle
- Damage
- Damage value of the current Cycle. For multiaxial fatigue, the reported damage is the worst damage out of all damages calculated for planes rotated by 10 degrees. The plane with maximum damage at each location is called the critical plane and this is reported.
- Damage Model
- Damage model being used for this Cycle, and additionally also lists the critical plane determined to have the maximum damage (possible planes are T0, A0, A45, B45).
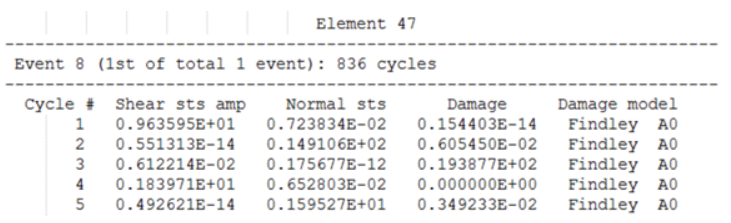
Figure 11. Findley Damage Model
- Element ID
- The header at the top of the table consists of the Element ID of consideration.
- Event ID
- The first line under Element header indicates the ID of the FATEVNT Bulk Data Entry and in parentheses lists the counter of the current FATEVNT under consideration out of the total number of FATEVNT entries.
- Number of Cycles
- Number of Rainflow cycles detected for the current Element in the current FATEVNT.
- Cycle ID
- Rainflow Cycle ID
- Shear Stress Amplitude
- Stress ampitude of Normal Stress for the current Cycle
- Normal Stress
- Normal stress for the current Cycle
- Damage
- Damage value of the current Cycle. For multiaxial fatigue, the reported damage is the worst damage out of all damages calculated for planes rotated by 10 degrees. The plane with maximum damage at each location is called the critical plane and this is reported.
- Damage Model
- Damage model being used for this Cycle, and additionally also lists the critical plane determined to have the maximum damage (possible planes are T0, A0, A45, B45).
Comments
- The I/O Option RESULTS controls the frequency of output for analytical results during an optimization.