View SLM Analysis Results
View, animate, and plot the results of a 3D printing analysis.
Before viewing results, you must first run a 3D printing
analysis using the Run Analysis tool.
-
Click Show Analysis Results
 on the Analyze icon to load
the results.
on the Analyze icon to load
the results.
-
Select a result type. The
result is displayed in the modeling window.
The results slider is scalable and provides a color gradient for the selected result type.
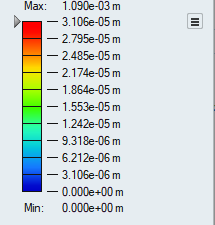
- To change the upper or lower bound for the results slider, click on the bound and enter a new value. Click the reset button to restore the default values.
- To filter the results so that areas on the model with results greater than a specified value are masked, click-and-drag the arrow on the results slider.
Note:
- To change the legend color for the result type, click the icon next to the results slider and select Legend Colors.
- To delete a run from the Analysis Explorer, right-click the run name to select Delete Run from the context menu.
Show Options
Determine what is made visible in the modeling window when viewing analysis results. You can show or hide the initial shape, loads and supports, deformation, and/or contours.
| Option | Description | Note | |
|---|---|---|---|
| Show/Hide Initial Shape | Show/hide the initial shape as a reference. | ||
| Show/Hide All Loads and Supports | Show/hide loads and supports. You can also show only the current loads and supports. | ||
| Show/Hide Deformed State | Show/hide the deformed shape as a reference. | ||
| Show/Hide Contours | Show/hide contours. | ||
| Options |
|
||
| Show/Hide Elements | Show/hide the element edges. | This icon appears under the view controls in the lower left of the modeling window, but only when the Analysis Explorer is active. | |
Callouts
Create, show, hide, and list callouts for selected result types at points of interest on your model.
After running an analysis, click the Show Analysis Results on the Analyze icon. Options for callouts appear in the Callouts section of the Analysis Explorer.
| Callout Icon | Description | Note |
|---|---|---|
| Create, Show, and Hide Callouts |
Click the |
After creating callouts, click the |
| List Callouts |
Display a list of all callouts in a table. Each callout is specific to the selected run. For structural analysis, it is also specific to the selected load case. | Click the |
| Min/Max Callouts |
Create a callout showing where the minimum/maximum value occurs for
the selected result type. Note: When factor of safety
is selected, the minimum value is shown.
|
Click the min/max callout in the modeling window to create a regular callout at the same location. |
| Options |
Dynamic Callouts: Make callouts dynamic, so they display the value of the currently selected result type. | If you enable the Compare Results feature in a callout, the callout becomes static. |
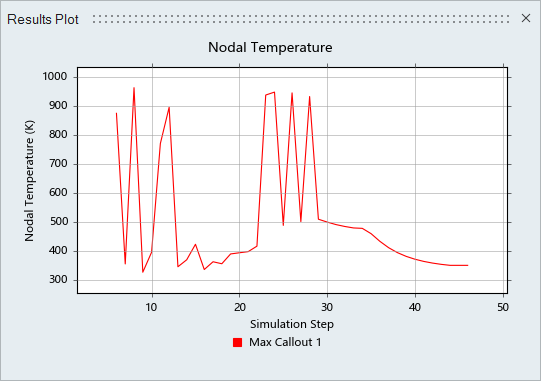
Plot Print3D Results
If you've previously run a 3D printing analysis, you can plot the results from the Analysis Explorer.
Prerequisite: Run a Print3D analysis and view the
results.
-
Click the
 icon under
Callouts and create at least one callout for each
result type you want to plot.
icon under
Callouts and create at least one callout for each
result type you want to plot.
-
Click the Plot
 icon to view the results plot.
 Tip:
Tip:- Select a callout in the modeling window to highlight it in the plot.
- Select the callout label in the plot to hide it.