Review Flexible Body Results
Review and animate flexible body results including local deformations, stress, and strain apart from the rigid body results.
To view flexible body results, you must create a flexible body and run a motion analysis first.
-
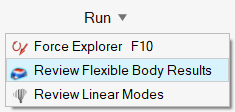
Select Review Flexible Body Results on the Run
menu.
Animation Toolbar
Use the animation toolbar to play, record, and configure the animation.

Figure 1. Animation Toolbar
- Animation Settings
- Click to open the Animation Settings.
- Play and Record/Stop Recording
- Click the button to begin recording the results; the icon changes to red to indicate that it is recording. Click the icon again to stop recording.
- Start Animation/Pause Animation
- Click the button to start or pause the animation. Use the arrow buttons to jump the first or last frame in the animation.
- Move to First/Previous/Next/Last Step
- These buttons allow you to step through the animation frame-by-frame. If you hold down the Previous or Next button, it will auto-repeat. If you want to skip frames, use the Increment By feature in the Animation Settings; hold Ctrl to temporarily override this behavior.
- Slider
- Drag the slider on the toolbar to view a particular point during the analysis; use the arrow keys to move frame-by-frame through the animation.
- Current Step
- Displays the current time or frame. You can also enter a value to go to the nearest time/frame.
- Connection Results (structures only)
- Click to extract reaction forces at fasteners. This option is only avaiable for structural analysis.
- Make Current Frame the New Design Position (motion analysis only)
- Click to use the current position of the mechanism as the model's starting point for the next run. This option is only avaiable for motion analysis.
- Plot Manager (motion analysis only)
- Open the Plot Manager to browse and plot motion results data, create cross plots (data vs. data), define pages in different layouts, and save the plots you've defined as a template for reuse. This option is only avaiable for motion analysis.
- Display Linear Modes Table (motion linear analysis only)
- Open the Linear Modes table to view the results of a linear analysis in complex number form with natural frequencies and damping ratio. This option is only avaiable for linear motion analysis.
Show Options
Determine what is made visible in the modeling window when viewing analysis results. You can show or hide the initial shape, loads and supports, deformation, and/or contours.
| Option | Description | Note | |
|---|---|---|---|
| Show/Hide Initial Shape | Show/hide the initial shape as a reference. | ||
| Show/Hide All Loads and Supports | Show/hide loads and supports. You can also show only the current loads and supports. | ||
| Show/Hide Deformed State | Show/hide the deformed shape as a reference. | ||
| Show/Hide Contours | Show/hide contours. | ||
| Options |
|
||
| Show/Hide Elements | Show/hide the element edges. | This icon appears under the view controls in the lower left of the modeling window, but only when the Analysis Explorer is active. | |
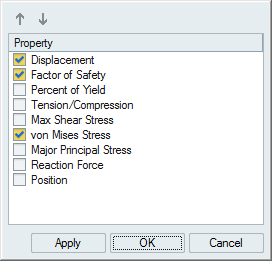
Callout Options
Add visual callouts to show points of interest on your analysis results.
| Option | Description | Note |
|---|---|---|
| Create, Show, and Hide Callouts |
Select to create callouts; select to show and hide callouts. |
|
| List Callouts |
Display in a table all of the callouts that have been created, with
the result types and values. Each callout is specific to the selected
run and load case.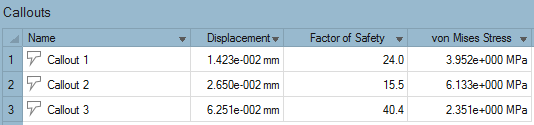 |
|
| Min/Max Callouts |
Create a callout showing where the minimum/maximum value occurs for
the selected result type. Note: When factor of safety is selected, the
minimum value is shown.
|
|
| Plot | Display time history plots for callouts defined for structural analysis. Changes made to the Result Types option are synchronized with the setting on the Analysis Explorer. Using this option allows you to put multiple plots of mixed types on a single page. | This option is only available for motion part analysis results. |
| Dynamic Callouts |
Display the results of various result types in existing callouts.
Note: If you enable the Compare Results feature in a callout, the
callout becomes static.
|
After creating a callout for a particular result type, click the
|
Compare Results
Compare the results of multiple analysis runs in a table. The Compare Results button is located at the bottom of the Analysis Explorer.
For analysis, you can compare results across all runs and load cases for the selected result type. You can also compare result types at a point of interest where you have placed a callout.
-
Click the Compare Results button located at the bottom
of the Analysis Explorer.
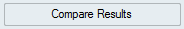
The table for comparing results appears at the bottom of the modeling window.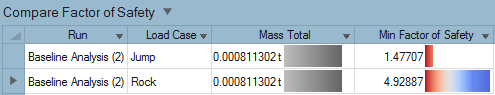
Additional columns can be added to show additional result types and parameters from the Run Analysis window. The red-blue color bands correspond to the legend in the Analysis Explorer; the width of the band indicates the magnitude of the result. Changes to the upper and lower bound in the Analysis Explorer are automatically reflected in the Compare Analysis Results table.