Optimization Summary Table Data
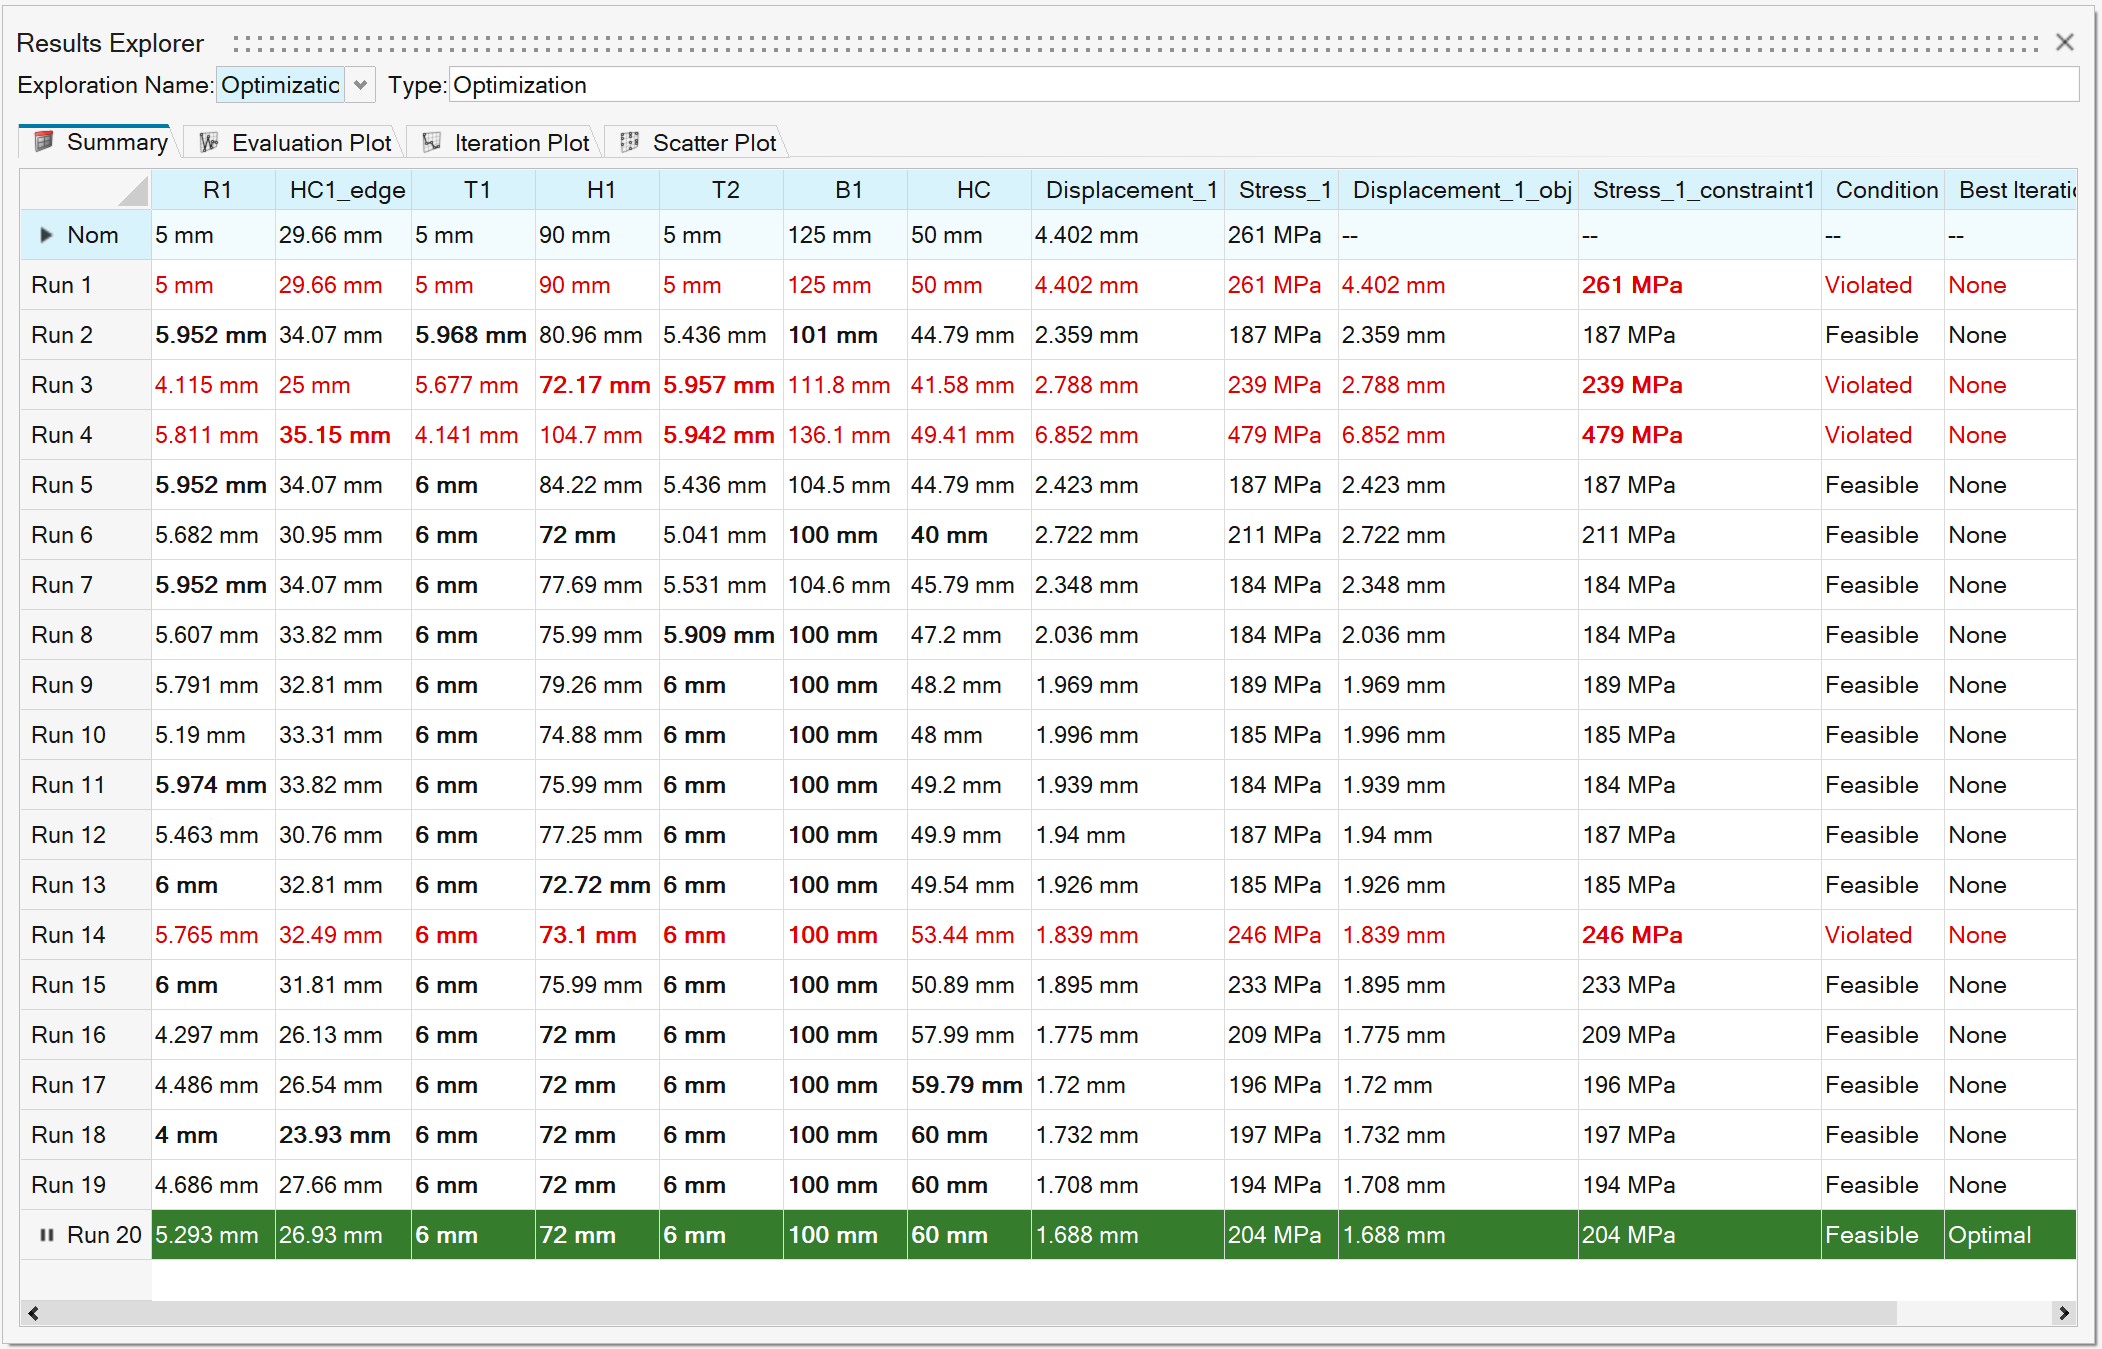
The optimization summary table shows the design variable values along with the calculated objective and constraint values for each run.
General Column Data
Column Color Coding
The Optimization Summary table uses color coding to help you determine which designs
are feasible, optimal, and violated. If an iteration contains a
violated constraint, the violated constraint is displayed in a bold font.
- White Background/Black Font
- Feasible design
- White Background/Red Font
- Violated design
- White Background/Orange Font
- Acceptable design, but at least one constraint is near violated
- Green Background/White Font
- Optimal design
- Green Background/Orange Font
- Optimal design, but at least one constraint is near violated