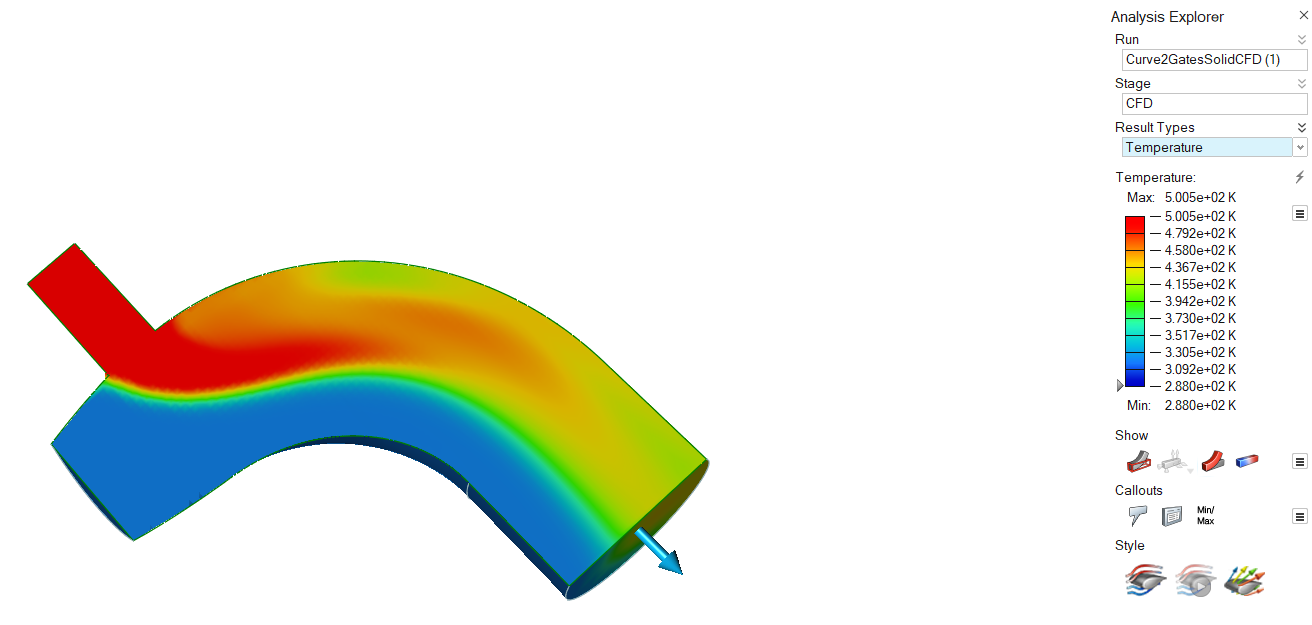
Show CFD Results
View the results of a CFD simulation in the Analysis Explorer.
Analysis Explorer Options
The Analysis Explorer includes the following options.
Run
To delete a run from the Analysis Explorer, right-click the run name to select Delete Run.
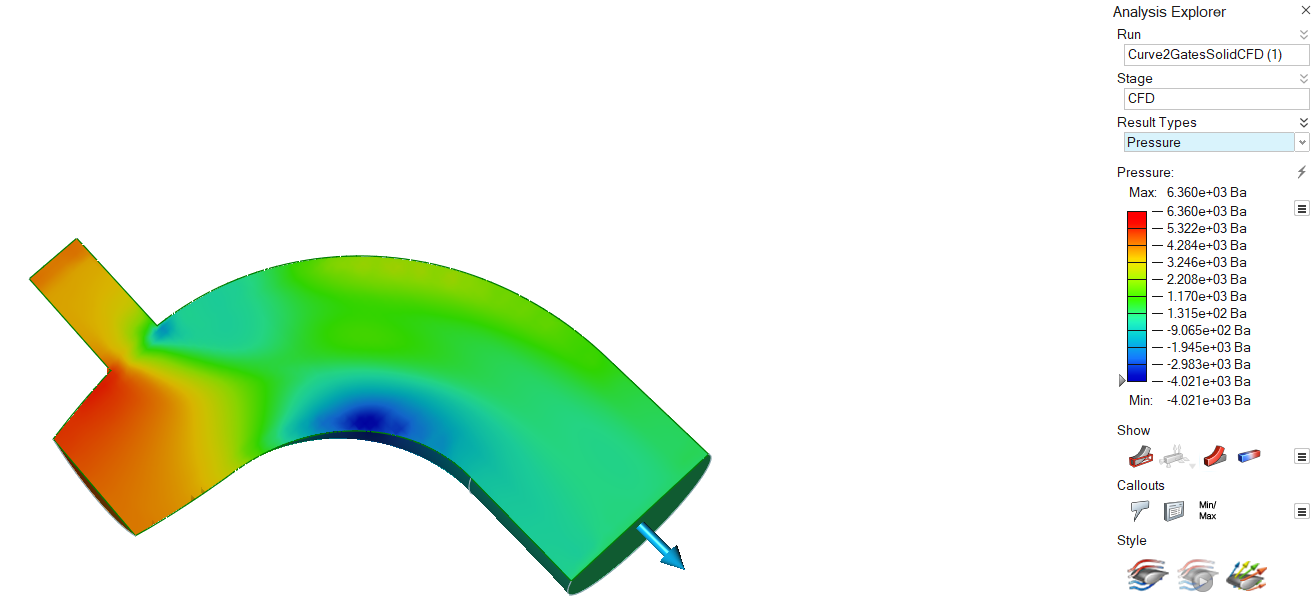
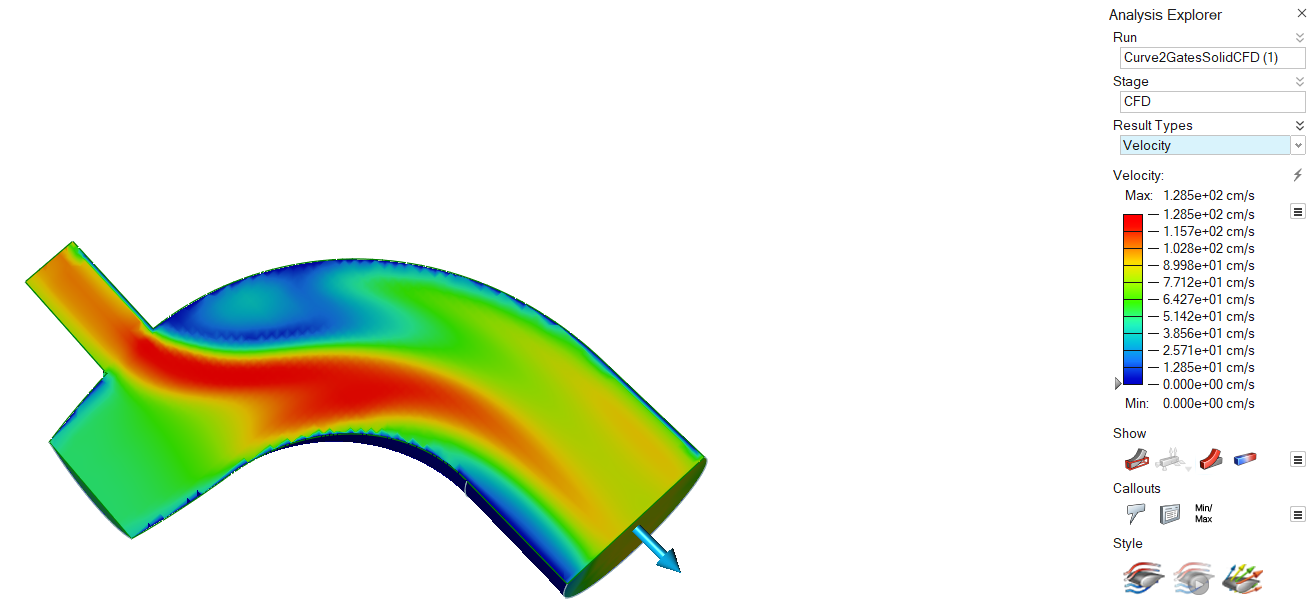
Result Types
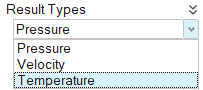
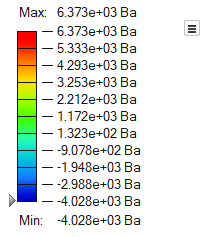
Pressure
Velocity
Temperature
Results Slider
- To change the upper or lower bound for the results slider, click on the bound and enter a new value. Click the reset button to restore the default values.
- To filter the results so that areas on the model with results greater than a
specified value are masked, click and drag the arrow on the results slider.
To mask areas with results less than the specified value, click
 and select Flip
Mask. Select the arrow to enter a specific value.
and select Flip
Mask. Select the arrow to enter a specific value. - To change the legend color for the result type, click the icon next to the results slider and
select Legend Colors.
Show/Hide Elements
When the Analysis Explorer is active, an additional Show/Hide
Elements
![]()
![]() icon appears under the view controls in the lower left
corner of the modeling window.
icon appears under the view controls in the lower left
corner of the modeling window.
Show Options
Determine what is made visible in the modeling window when viewing analysis results. You can show or hide the initial shape, loads and supports, deformation, and/or contours.
| Option | Description | Note | |
|---|---|---|---|
| Show/Hide Initial Shape | Show/hide the initial shape as a reference. | ||
| Show/Hide All Loads and Supports | Show/hide loads and supports. You can also show only the current loads and supports. | ||
| Show/Hide Deformed State | Show/hide the deformed shape as a reference. | ||
| Show/Hide Contours | Show/hide contours. | ||
| Options |
|
||
| Show/Hide Elements | Show/hide the element edges. | This icon appears under the view controls in the lower left of the modeling window, but only when the Analysis Explorer is active. | |
注釈オプション
解析結果の注目箇所を示す注釈を追加します。
| オプション | 説明 | メモ |
|---|---|---|
| 注釈の作成、表示、非表示 |
選択して注釈を作成し、注釈の表示/非表示を選択します。 |
|
| 注釈のリスト |
作成したすべての注釈が、結果のタイプと値と共にテーブルに表示されます。各注釈の値は、選択された実行と荷重ケースに固有です。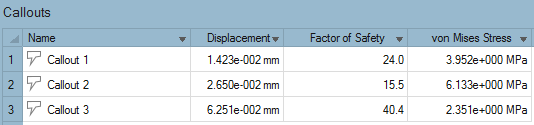 |
|
| 最小値 / 最大値の注釈: |
選択した結果タイプの最小値または最大値の発生場所を示す注釈を作成します。 注: 安全係数が選択されている場合は、最小値が表示されます。
|
|
| プロット | 構造解析用に定義された注釈の時間履歴プロットを表示します。結果タイプオプションの変更は、解析エクスプローラの設定と同期されます。このオプションを使用すると、複数のタイプが混在した複数のプロットを1つのページに配置することができます。 | このオプションは、モーションパート解析結果でのみ使用できます。 |
| ダイナミック注釈 |
既存の注釈にさまざまな結果タイプの結果を表示します。 注: 注釈で結果の比較フィーチャーを有効にすると、注釈は静的になります。
|
特定の結果タイプの注釈を作成後に、 |
Style Options
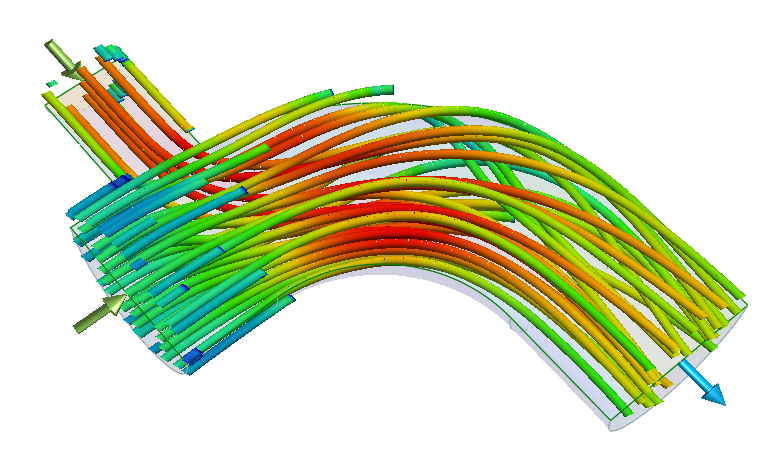
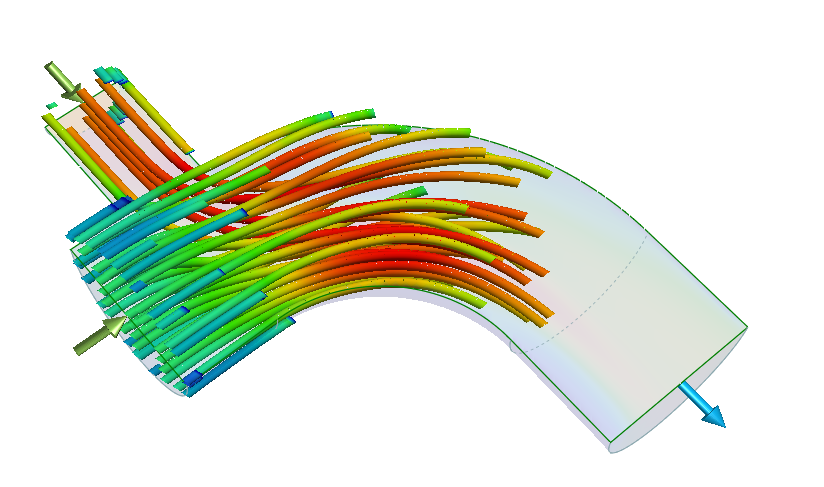
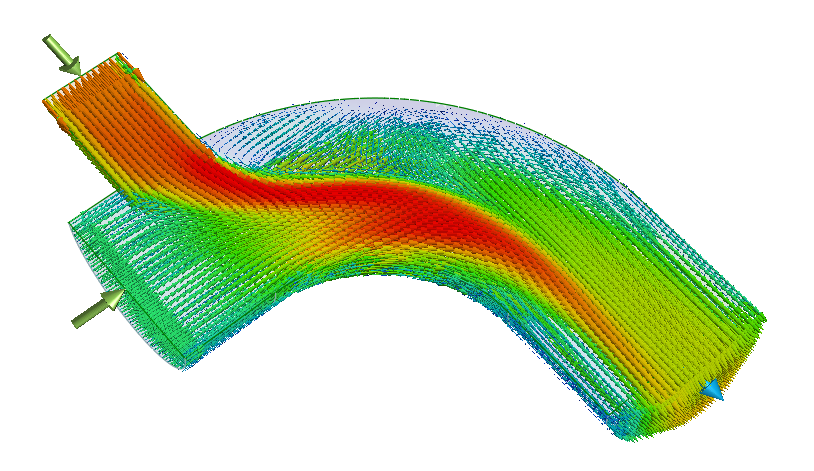
Visualize the results as static streamlines, animated streamlines, or vectors.
| Option | Description |
|---|---|
| Static Streamlines |
Visualize the results as static streamlines. In the microdialog, you
can adjust the following parameters:
 |
| Animated Streamlines |
Only available if Streamlines is turned
on. Click the icon once to visualize the results as animated
streamlines. Click the icon again to jump to the end of the
animation.
 |
| Vectors |
Visualize the results as vectors. In the microdialog, you can adjust
the following parameters:
 |