Source Coupling by Step
This option allows the user to visualize the coupling values at each step in a graph. The user needs to select the frequency, observation and polarization they want to plot the values for. When the user presses the "Add Series" button, a plot will be added.
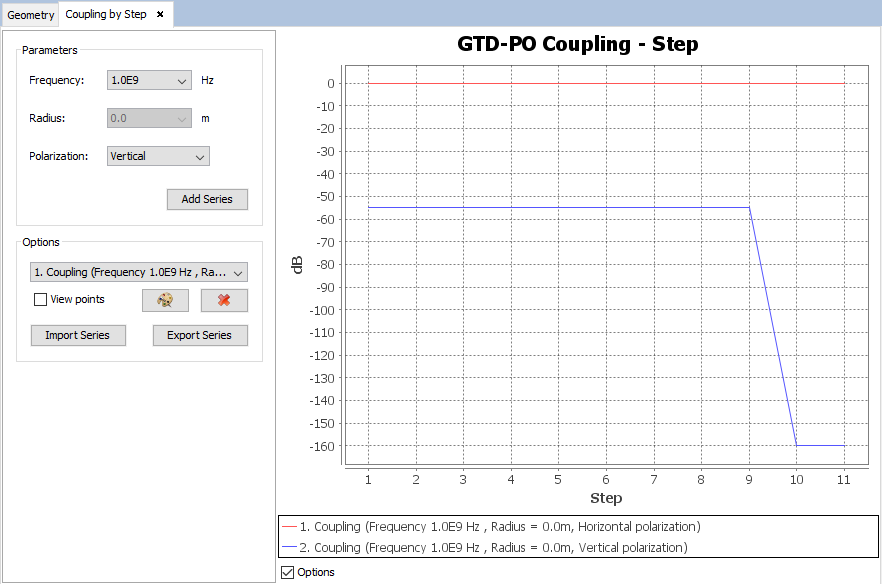
Figure 1. Visualizing coupling values by step
The user can also import and export each of the plots (series) from/to a text file. To import, the user needs to press the "Import Series" button and select the text file. Similarly, to export, the user needs to select the desired series to export, press the "Export Series" button and select the location the user wants to save the file to. The user can also remove previously added series, as well as change their display colors.