This section explains the following properties panel, that appears clicking on
"Properties..." option on the main menu:
This panel is divided on three tabs:
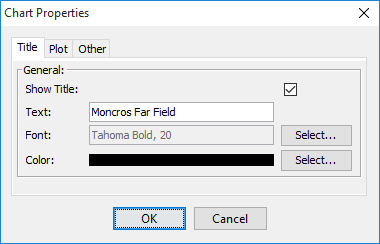
Title
This tab allows the user to configure the following parameters referenced to the title
of the chart:
Show Title. When this check box is selected, the title will be visible on the chart
panel, otherwise there is no visible title.
Text. This text field set the name for the chart title.
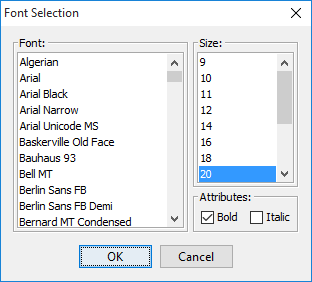
Font. This option allows the user to configure the font settings. The text field
resumes the current configuration and "Select..." button displays a panel to
customize the configuration.
Font. With this panel the user select the font family for the title.
Size. With this panel the user select the font size for the title.
Attributes. With this panel the user can apply bold and italic effects to the
font.
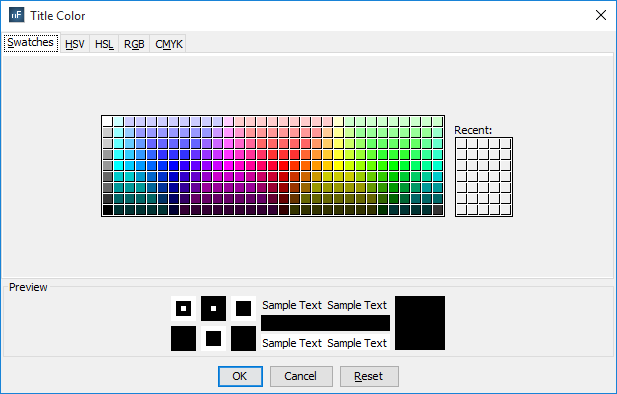
Color. This option allows the user to configure the font color. The text field shows
the current color and "Select..." button displays a panel to select a new color.
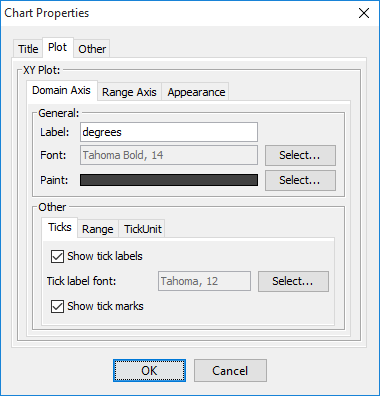
Plot
This tab allows the user to configure
the parameters for the axis and the appearance, divided on three tabs:
Domain Axis. With this tab the user configures the parameters for the horizontal
axis (X):
"General" panel has the following parameters:
Label. This text field set the name for the axis.
Font. This option allows the user to configure the font settings. The text
field resumes the current configuration and "Select..." button displays a panel
to customize the configuration. The panel that appears is the same as the
'Font' option explained on 'Title' tab.
Paint. This option allows the user to configure the font color. The text field
shows the current color and "Select..." button displays a panel to select a new
color. The panel that appears is the same as the 'Font' option explained on
'Title' tab.
"Other" panel has the following parameters, divided on three tabs:
Ticks. This tab configures the parameters to the ticks of the axis:
Show tick labels. When this check box is selected, ticks values will be
visible over the axis.
Tick Label Font. This option allows the user to configure the font settings.
The text field resumes the current configuration and "Select..." button
displays a panel to customize the configuration. The panel that appears is the
same as the other 'Font' option explained on this section.
Show tick marks. When this check box is selected, ticks will be visible over
the axis.
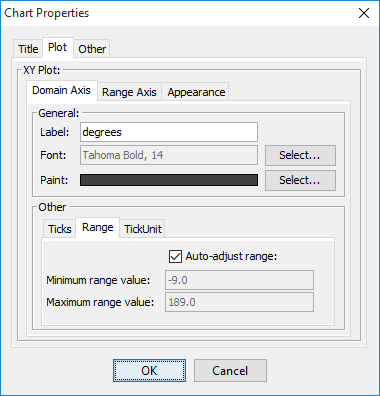
Range. This tab configures the parameters to the ticks of the axis:
Auto-adjust range. When this check box is selected, the maximum and minimum
visible values for the axis on the chart will be calculated automatically over
the range of values. This option calculates the total range with a margin
before the first value and after the last value of the represented plot.
Minimum range value. This option allows the user to configure the initial
value for the chart (this value is not the first value of the plot to be
represented). This value can be used to have or not a margin before the
represented plot. Can be used to eliminate some values at the beginning of the
represented plot. This option is only enabled if the "Auto-adjust range" check
box is not selected.
Maximum range value. This option allows the user to configure the final value
for the chart (this value is not the last value of the plot to be represented).
This value can be used to have or not a margin after the represented plot. Can
be used to eliminate some values at the ending of the represented plot. This
option is only enabled if the "Auto-adjust range" check box is not
selected.
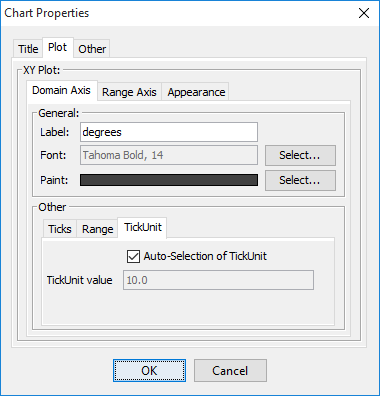
TickUnit. This tab configures the parameters to the units of the ticks of the
axis:
Auto-selection of TickUnit. When this check box is selected, the value between
two consecutive ticks for the axis on the chart will be calculated
automatically over the range of values.
TickUnit value. This option allows the user to configure the value for the
interval between two consecutive ticks. This option is only enabled if the
"Auto-selection of TickUnit" check box is not selected.
Range Axis. With this tab the user configures the parameters for the vertical axis
(Y):
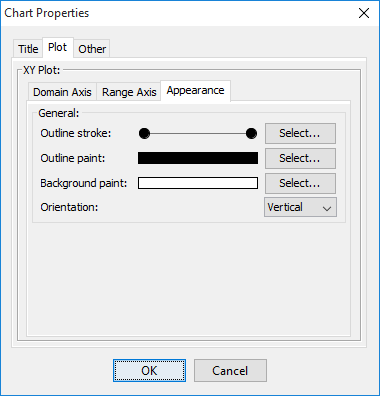
Appearance. With this tab the user configures the parameters for the chart:
Outline stroke. This option allows the user to select the type of the outline
of the chart. With "Select..." button a panel appears, where the user can
select the prefer type of line.
Outline paint. This option allows the user to configure the outline color of
the chart. The text field shows the current color and "Select..." button
displays a panel to select a new color. The panel that appears is the same as
the other color choosers explained on this section.
Background paint. This option allows the user to configure the background
color of the chart. The text field shows the current color and "Select..."
button displays a panel to select a new color. The panel that appears is the
same as the other color choosers explained on this section.
Orientation. This option allows the user to select the orientation of the
chart. When "Vertical" option is selected, the domain appears on the horizontal
axis and the range appears on the vertical axis. Otherwise, the axis for the
domain and the range will be changed.
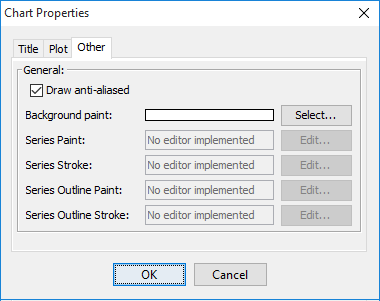
Other
This tab allows the user to configure the parameters for the appearance of the plot and
series:
Draw anti-aliased. When this option is selected,the display of the graph is
improved, smoothing the contours of the components. When this option is selected,
chart drawing has more definition for all the drawing components.
Background paint. This option allows the user to configure the Background color of
the chart panel, not the chart. The text field shows the current color and
"Select..." button displays a panel to select a new color. The panel that appears is
the same as the other color choosers explained on this section.
Series Paint. This option is not implemented.
Series Stroke. This option is not implemented.
Series Outline Paint. This option is not implemented.
Series Outline Stroke. This option is not implemented.