View Observation Points
This option shows the observation points as a plot.
Select the theta or phi cut using the controls and press OK. After selecting the desired options and pressing OK, the following screen will be shown:
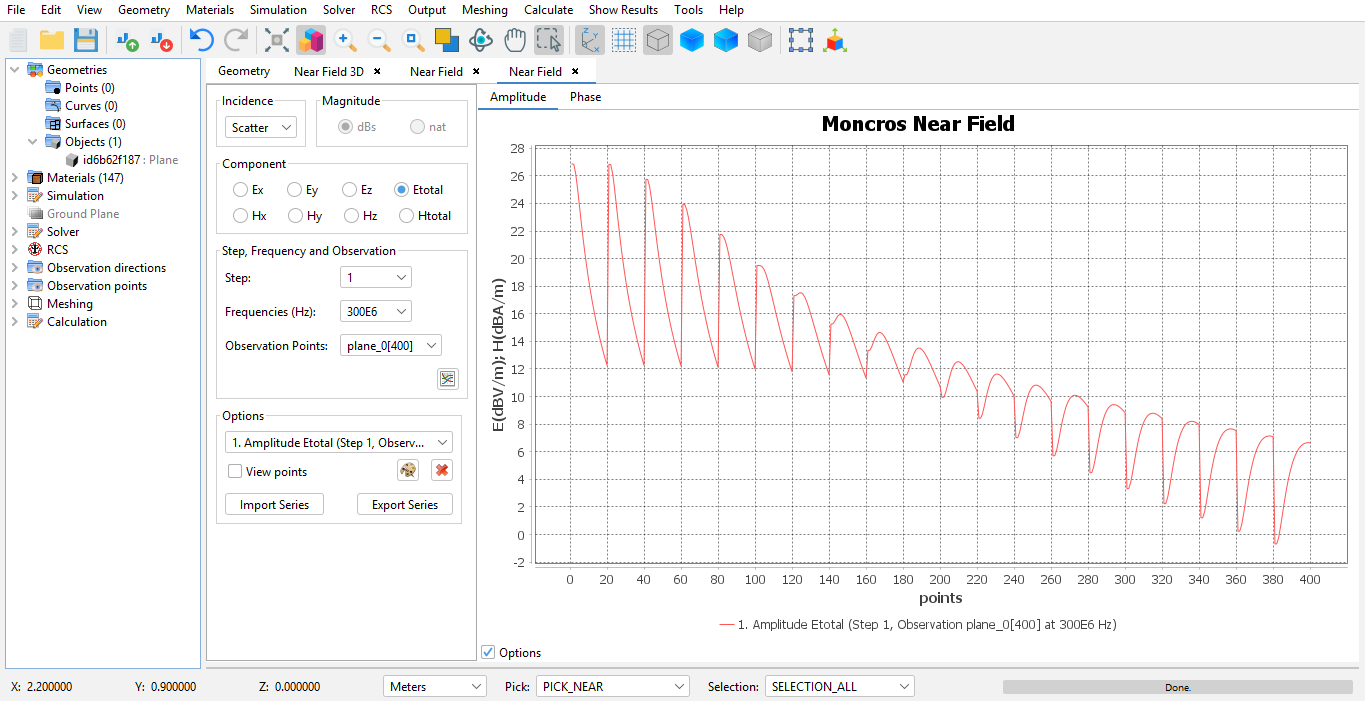
Figure 1. View Observation Points panel
The controls on the left let the user add, modify and delete series. Using the visible controls the user can select a series to add using the following settings:
- Incidence: which kind of near field incidence to add scatter incidence, direct incidence or total incidence.
- Field Component: which field component to inspect, from either the E-field or the H-field, and whether to inspect the X, Y or Z component or the total field.
- Step: on simulation projects that make use of step, the user can select the step number to add.
- Frequencies: on simulation projects that make use of multiple frequencies, the user can select one particular frequency to add.
- Observation points: on simulation projects that make use of multiple observation point structures, the user can select one of the geometries.
Press the Add Series button to add the series to the graph. Note that if multiple cuts exists, a dialog similar to the one that appeared before will be presented to the user again asking to select a particular theta cut or phi cut.
It is possible to modify already existing series too. The user cans et the color for the series, which is useful when multiple series have been added to the plot. Select the series using the List of series control, and press Change colors to modify the color used to render the series. Additionally, a series can be removed if it's not relevant anymore to the purpose of the plot.
It is also possible to export already existing series and import series previously imported, which is useful for comparing series made using different projects or simulations.