View Charges
This visualization option allows the user to see a representation of the charge density. A color legend shows the magnitude of the charge values corresponding to each color shown on the geometry (at the right side of the screen).
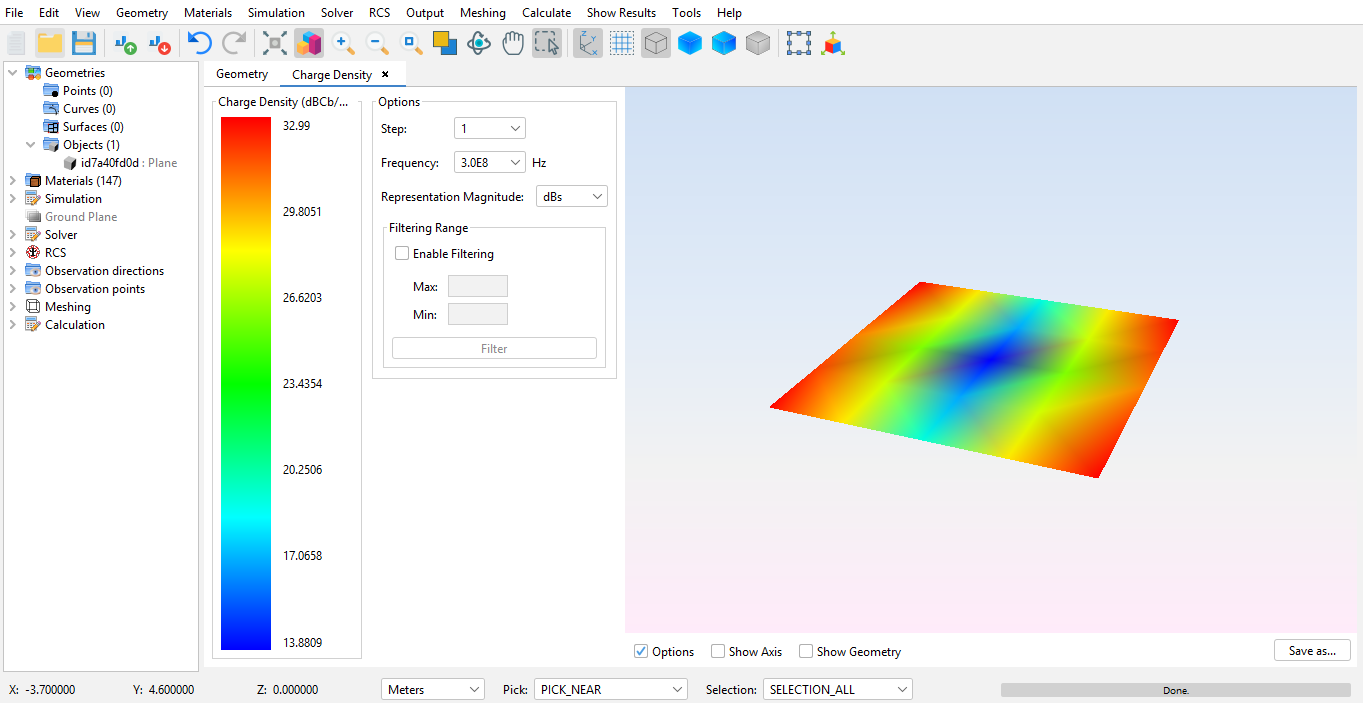
Figure 1. Charges diagram
The following options are available at the left side.
- Step and Frequency: on projects that make use of multiple steps and frequencies, it is possible to select a particular step and frequency.
- Magnitude: the magnitude that is used to represent the values.
- Filtering range: by default the values are assigned a color scale where blue is the lowest value and red is the highest value. It is possible to change this to use a custom filter scale by enabling this option and setting the minimum and maximum value.
Additionally, the following options are available at the bottom bar:
- Options: hides and shows the options panel that appears on the left.
- Show geometry: use this option to make the geometry visible or not.
- Show Axis: use this option to hide or show the axis.
It is also possible to export a graphical representation of the image. Press Save as... to save the image as a PNG file.