Example 1: Propagation Factor on an Existing Terrain
In this example, the propagation factor of a simple antenna is calculated and visualized.
Step 1
Start newFASANT.
Step 2
Select File and click on New.
Step 3
Select PE.
Step 4
Click on Terrain→Import Terrain, and a new tab will appear.
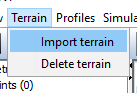
Figure 1. Import Terrain Menu
Step 5
In the Import Terrain tab click browse and select the desired file.

As the file is .asc it's necessary to have a projection file. If it does not exist, clock OK in the pop-up window that will appear. Else, click on the Edit PRJ button next to browse.

Step 7
Select the type Geological, factor of 1 degree and 45º of latitude. Then click OK.

Step 8
Introduce the display options and click Save,

Step 9
When the terrain appears, click Profiles→Extract topographic profiles→Profile between two points.

Step 10
In the console, write the point "-3700 1600" and press enter, then do the same for the point "1100 -1600". This points can also be selected on the terrain.

Step 11
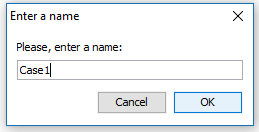
Select Simulation cases→New case. Click New Simulation Case. Then choose a name and press OK.

Step 12
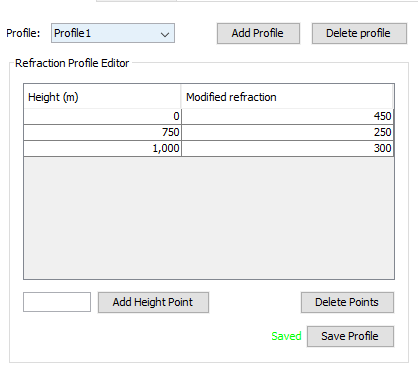
Click Add profile and choose a name.
Step 13
Add height points at 750 and 1000 meters and then change the refraction to match the image below. Then save the profile.
Step 14
Switch to the Case Definition tab. In the Topographic Profile section, choose the profile and set the reference height to 550 m.

Step 15
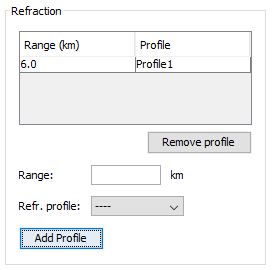
In the refraction section, select 6 km of range and the created refraction profile and press add.
Step 16
Set the antenna parameters. In this case we will use the default values.
Step 17
In the simulation parameters, set the range step size to 0.01 km, the height step size to 1m, the range limit to 5.5 km and the height limit to 600. Then save the simulation case.

Step 18
Select Calculate→Execute on the menu bar. Select the case to process and press execute.

Step 19
When the simulation finishes we can visualize the simulation results. Click on Results→Propagation Factor→Propagation Factor Spectrum.
Step 20
Select the case and press add series.

Step 21
Right click on any point at 250 m of height and select Profile at selected height.
Step 22
In the chart window add a series at 275 m to compare both values.
