Near Field 3D
This option allows the user to visualize a 3D diagram displaying the amplitude of the field values at each observation point, given the step and frequency. When this option is selected, the following panel appears:
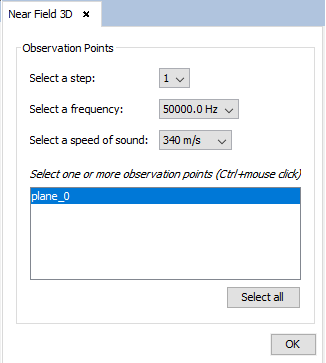
Figure 1. Near Field 3D options
In this panel, the user needs to select the step, frequency and speed of sound they want to visualize the 3D diagram for, as well as the group or groups of observation points they want to compute the near field for. After the user has configured the parameters and pressed the "OK" button, the following panel appears:
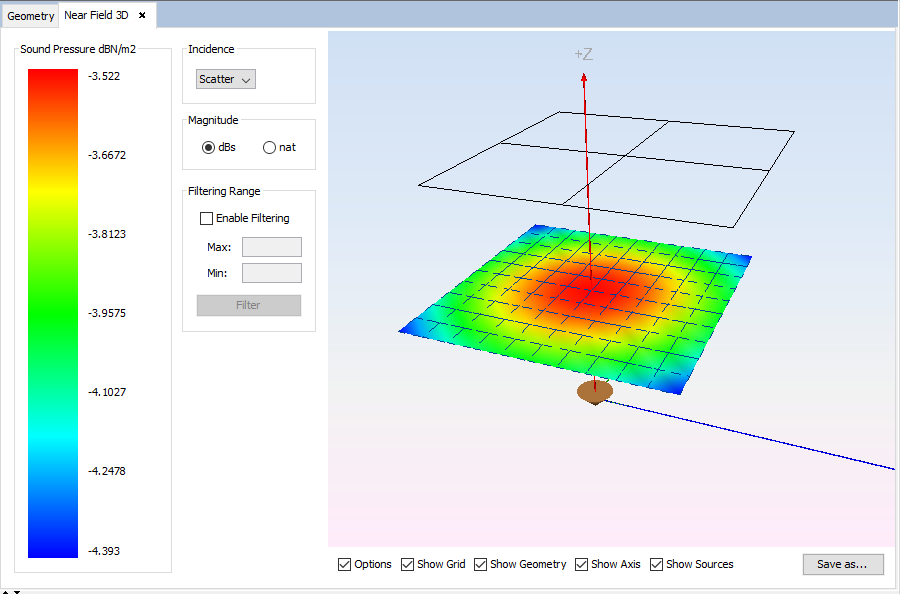
Figure 2. Near Field 3D diagram
The user can select whether they want to visualize the contributions of the direct rays to the field, the contribution of the scatter rays, or the total field. They can also select whether they want to visualize the results in logarithmic units (dBPa - that is, sound pressure with respect to 1 pascal in dB) or natural units (Pa). The user can also filter the displayed values within a range, by checking the "Enable Filtering" check box, entering the minimum and maximum values and pressing the "Filter" button.
Additionally, there are several options the user can use to alter the visualization of the results, such as possibility of hiding/showing the left panel, the observation points grid, the geometry, the axes or the sources. The user can also save the 3D diagram to an image file in a given location in their computer.