Power Process
This option allows the user to visualize the power of the emitted sound waves as received at each observation point. When the user selects this option, the following panel is shown:
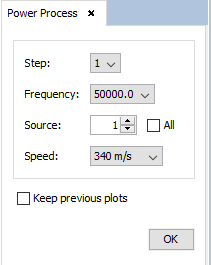
Figure 1. Power process options panel
In this panel, the user needs to select the step, frequency and speed of sound the results are visualized for. The user can select a specific source or compute the sum of the results of each one by checking the "All" option.
The "Keep previous plots" option allows the user to choose whether they want to preserve the previously plotted graphs (which could be useful if the user wants to compare several plots) or they want to clear all previous plots.
When the user presses the "OK" button, a graph like the following will appear, showing the power of the sound waves for each observation point:
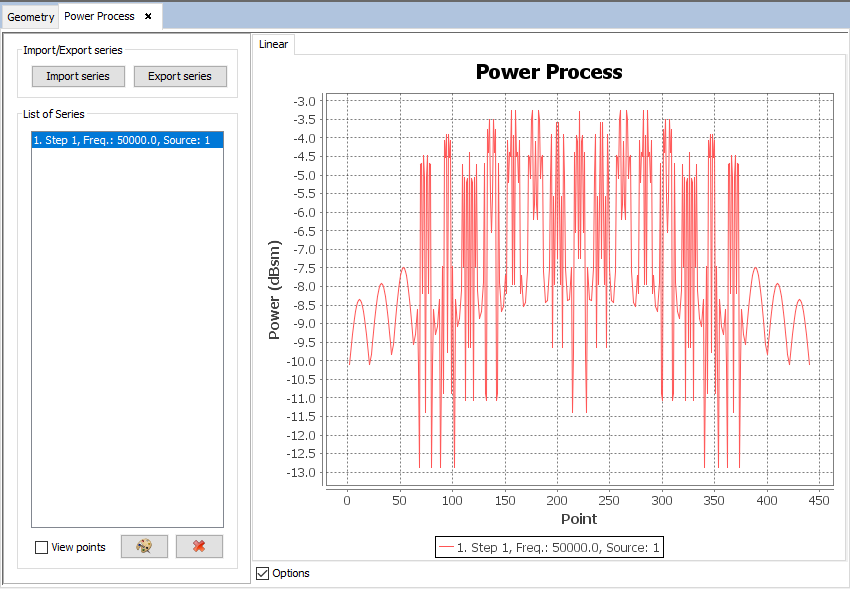
Figure 2. Plot of the power process