|
Adding Numeric Manual Bucketing
Numeric data is represented as a continuous set of values in displays and filters. Sometimes it may be necessary to manually specify customized limits. This can be achieved with Manual bucketing.
Steps:
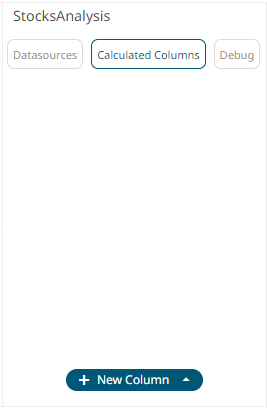
1. On the Data Source Settings pane, click Calculated Columns.
The Calculated Columns pane displays.
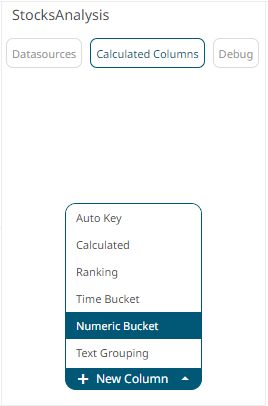
2. Click New Column > Numeric Bucket.
The numeric bucket instance is displayed on the Data Sources Settings with Numeric Bucket as the default title, also the Numeric Bucket Column pane displays.
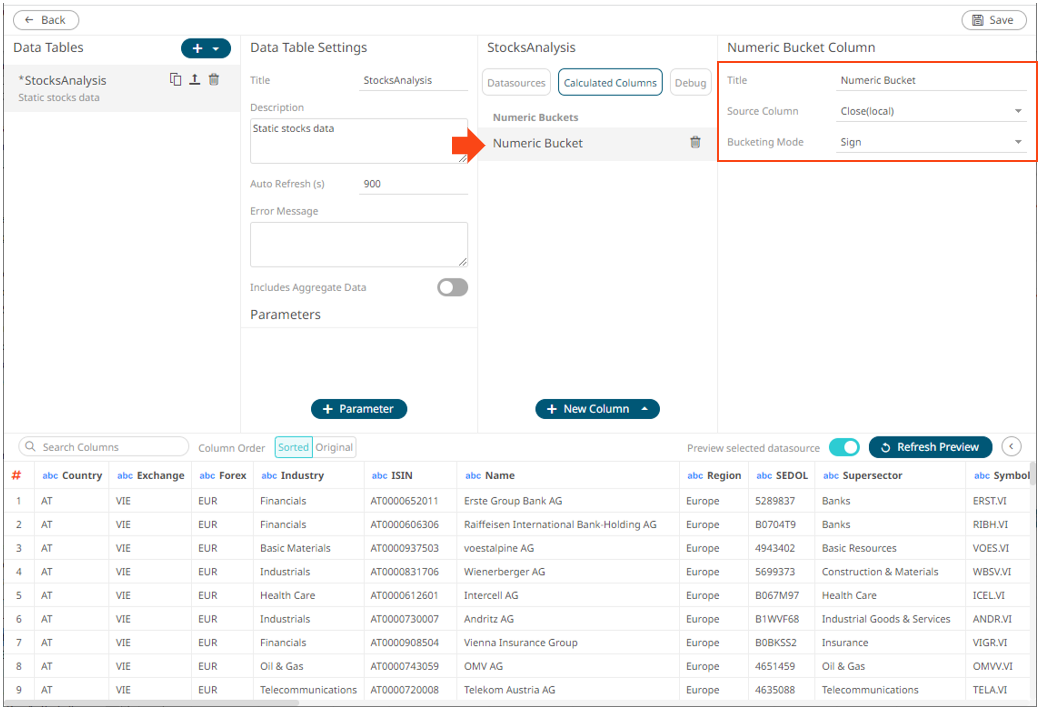
You may opt to modify the numeric manual bucket Title.
3. Select the numeric Source Column.
4. Select Manual in the Bucketing Mode drop-down list box.
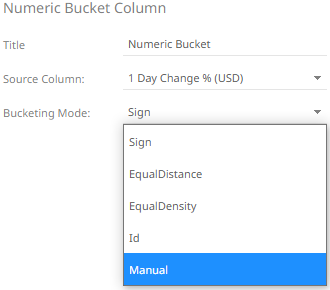
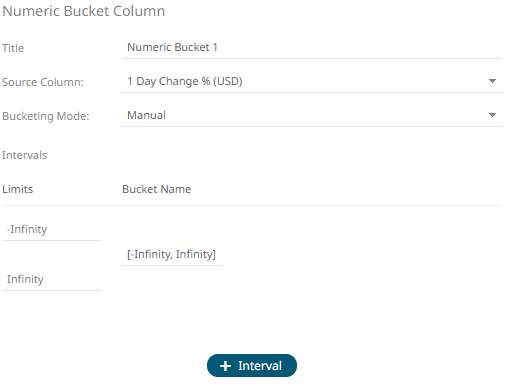
The Limits and Bucket Name fields are displayed.
5. Specify the customized limits of a bucket:
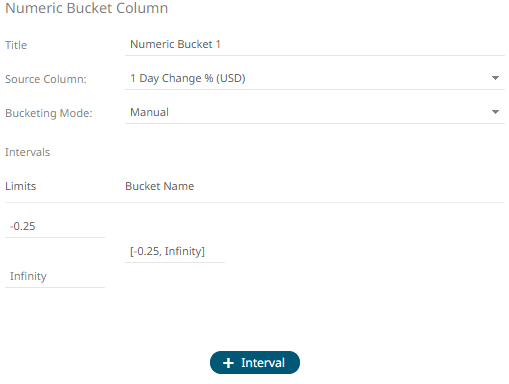
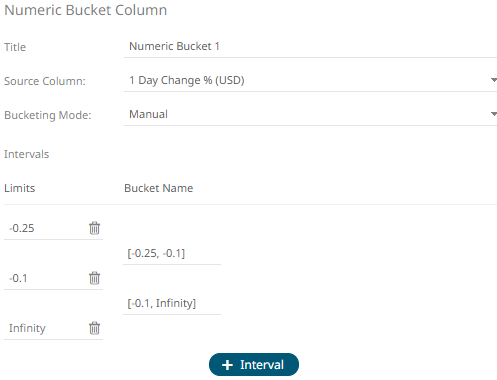
· Enter the –Infinity value in the Limits box with the minimum limit value of the bucket.
This value is displayed in the Bucket Name box replacing the –Infinity value.
· Enter the Infinity value in the Limits box with the maximum limit value of the bucket.
This value is displayed in the Bucket Name box replacing the Infinity value.
The range of the limits is now displayed in the Bucket Name box.
· You can opt to modify the Bucket Name.
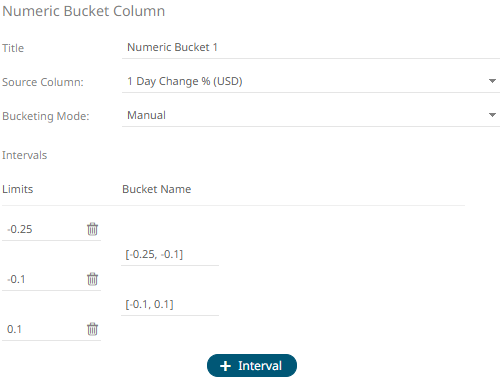
6. To add more buckets, click ![]() .
.
Another bucket definition box is displayed.
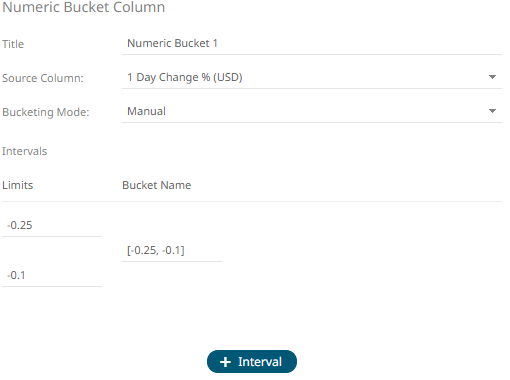
Note that the preceding Infinity bucket value is now the minimum limit value of the new bucket.
7. Replace the Infinity value in the Limits box with the maximum limit value of the new bucket.
This value is displayed in the Bucket Name box replacing the Infinity value.
To
delete manual bucket range limits, click their corresponding  button.
The Bucket Name value is adjusted based on the available limits.
button.
The Bucket Name value is adjusted based on the available limits.
8. After you are done adding buckets, click
 . The new numeric manual bucket column
is added and displayed in the Data Preview.
. The new numeric manual bucket column
is added and displayed in the Data Preview.
The new Manual bucket column will appear in the output data schema.
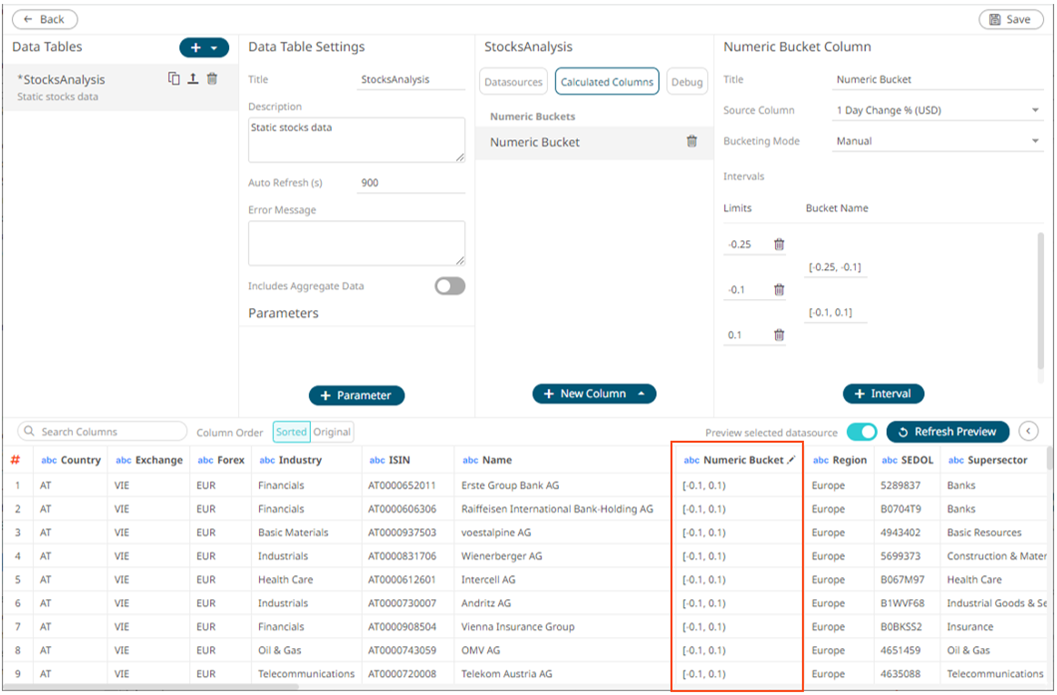
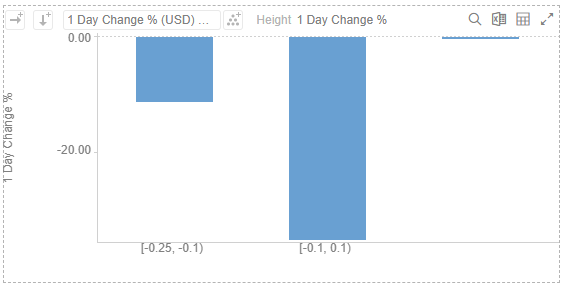
This new user defined column can be used in a visualizations breakdown to display data samples.