


|
Breakdown
You can define hierarchical structures called breakdowns for each visualization. The hierarchy may be flat (single level) or multi-level. You can also define multiple breakdowns for each visualization so you can readily select the one most appropriate for the analysis task at hand.
The breakdown consists of up to three components:
q Rows which cross tab the visualization into rows.
q Columns which cross tab the visualization into columns.
q Hierarchy which displays the hierarchy within the visualization.
Not all visualizations support all three. If no breakdown is defined, a single aggregated data point will be shown in the visualization.
If enabled, the Breakdown shelf appears at the top left of each visualization.
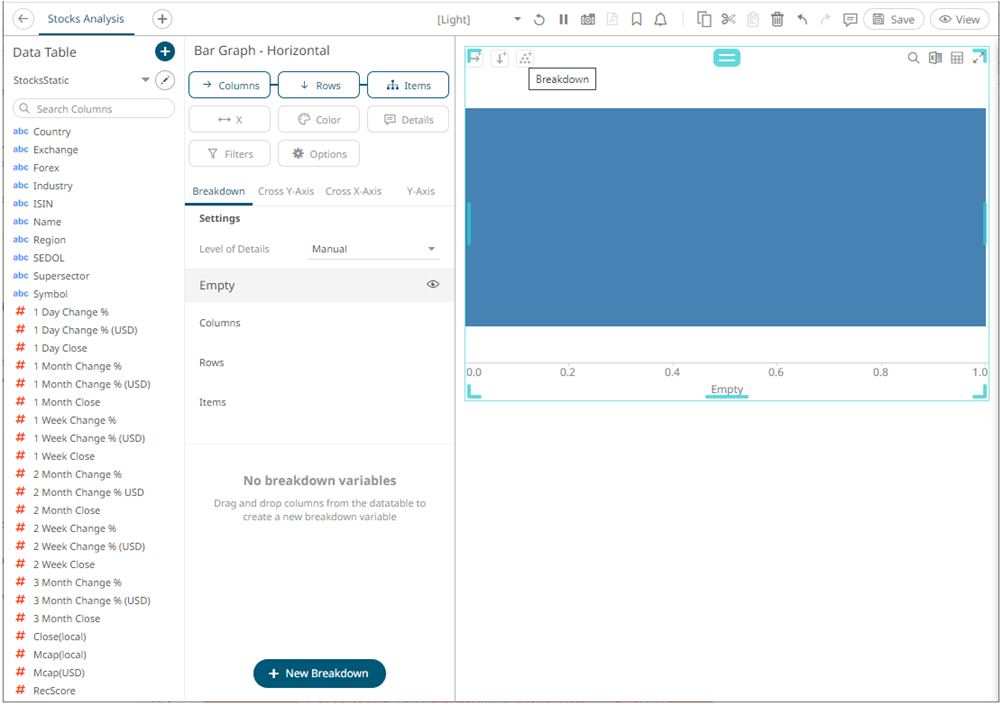
The example above shows that there are no columns added yet as a breakdown (Empty state) with the X variable default values (0.00 to 1.00).