|
Sorting the Visualization for Each Level of the Breakdown
You can sort visualizations based on the filled variables, plus alphabetically on the breakdown title.
For example, here are the available sorting methods for the Bar Graph – Horizontal visualization:
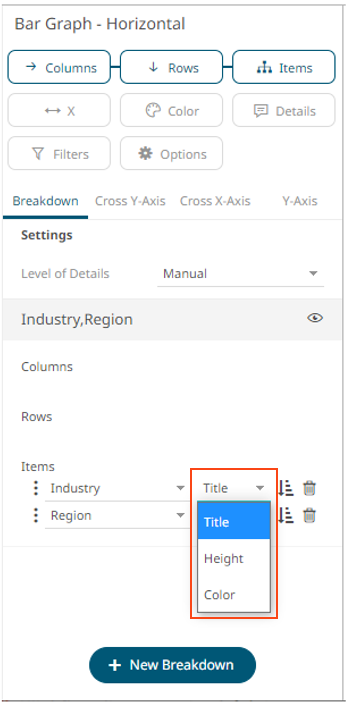
|
NOTE |
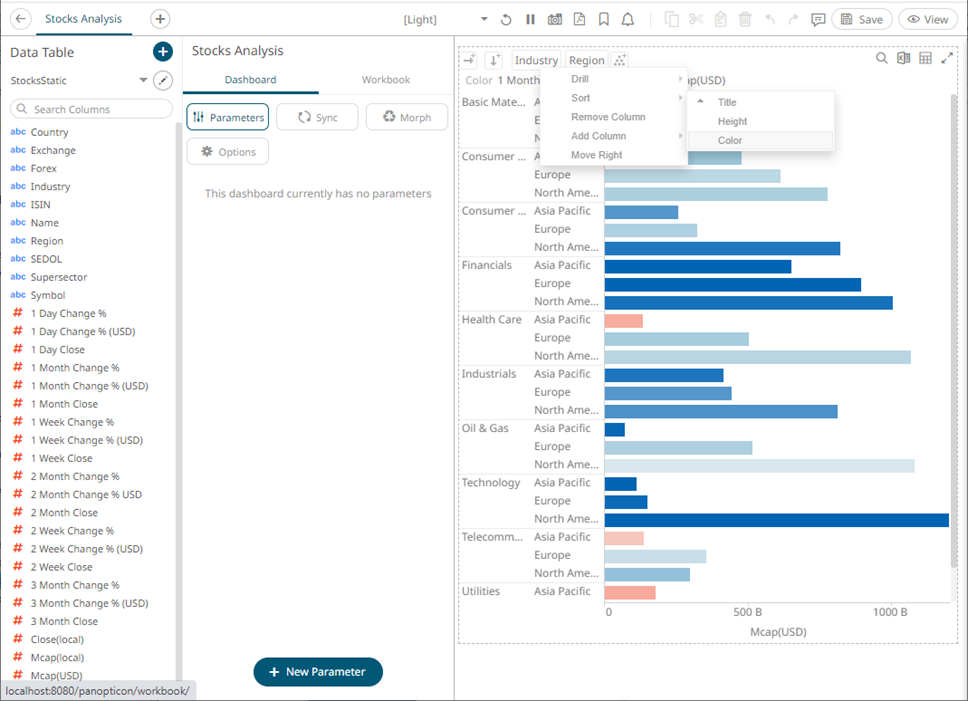
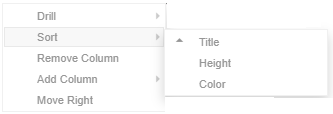
These sorting options are also available on the Breakdown column and Pivot point context menu:
|
q Sorting by Title (Default)
Sorting based on the breakdown column name values, in ascending order.
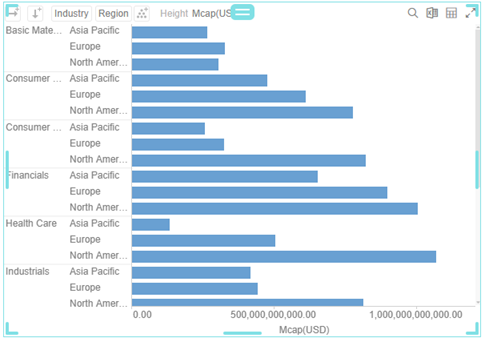
q Sorting by Height
Sorting based on the height (X) variable values (eg., Mcap(USD).
This type of sorting is most useful in the following visualizations:
· Bar Graphs
· Treemaps (to produce a Heat Map)
· Stack Graphs
· Horizon Graphs
· Sorting by Color
Sorting based on the color variable values (e.g., 1 Month Change % (USD)).