


|
Visualization Static Filter
You can define a filter to a visualization based on a specific subset of the available data.
Steps:
1. Click on a visualization to display its Properties pane.
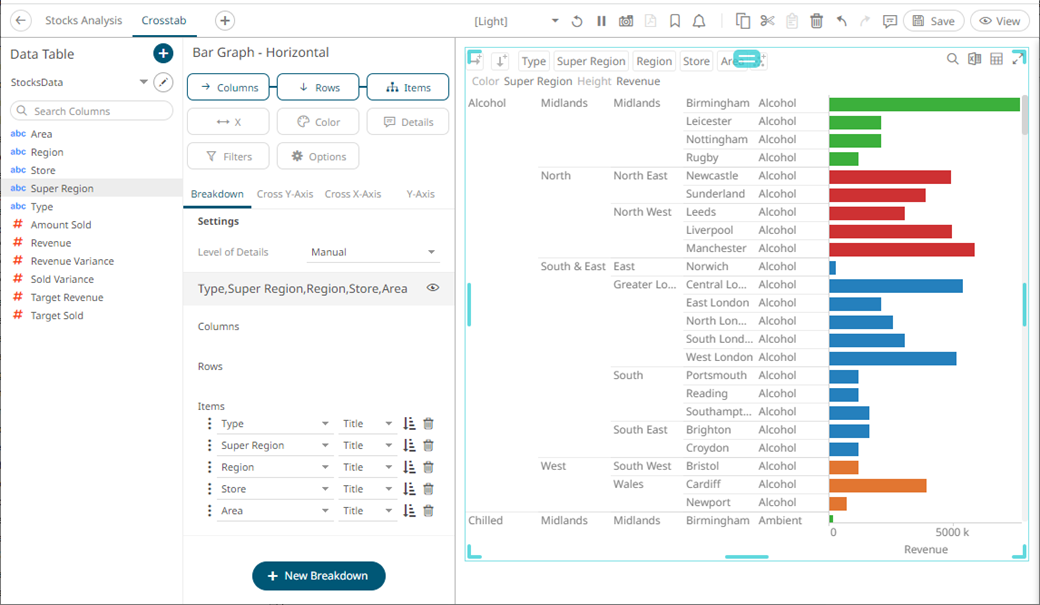
2. To add to the filter, drag text columns from the Data Table pane to the Filter drop area.
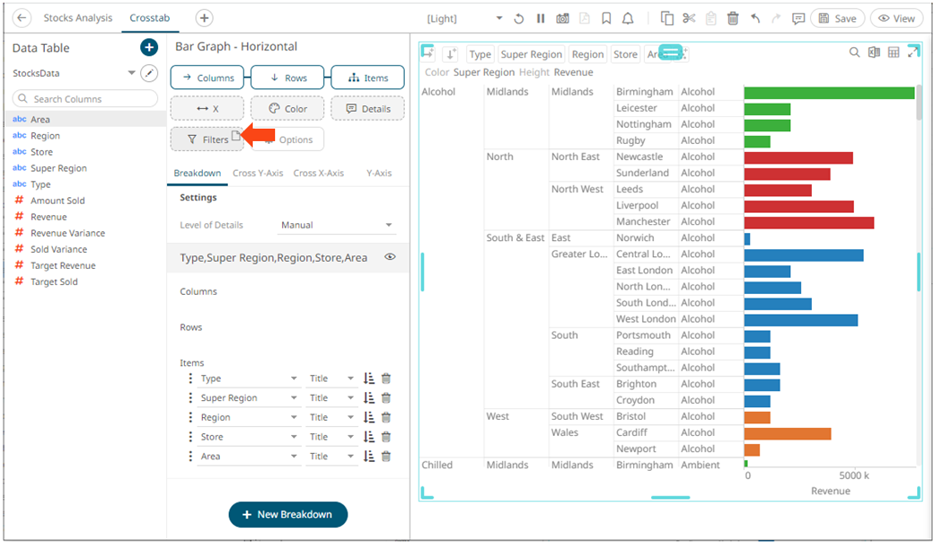
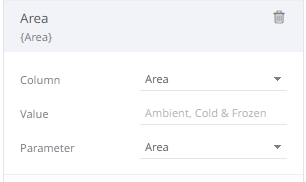
3. The column is added and the Visualization Settings pane changes to display the Filter properties.
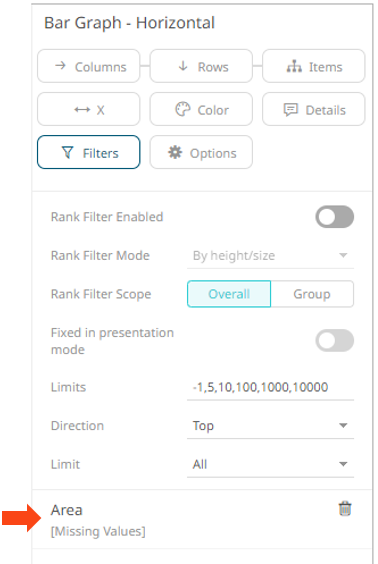
Initially, there are no values added for the filter column.
4. Click on the filter column. The pane changes again.
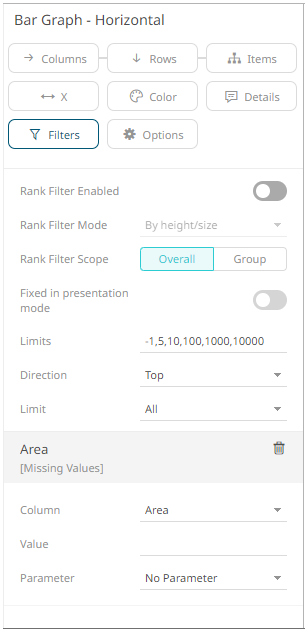
5. Enter the Value.
|
NOTE |
You can add more than one value for a column. For example:
|
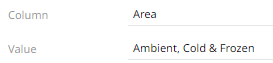
The visualization is updated based on the filter column values.
6. You can opt to select a set dashboard parameter from the Parameter drop-down list.
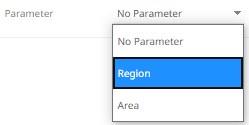
This will overwrite the entered filter values.
|
NOTE |
The selected parameter must have values that are available on the filter column.
|
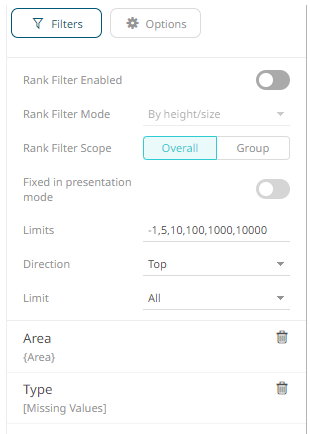
7. Drag and drop other text columns to add more filters.
8. Repeat steps 4 to 6 to define its value.
9. Click the Save  icon on the toolbar.
When
saved, the  notification
is displayed.
notification
is displayed.