


|
Table Visualization
The Table visualization warrants a separate explanation; given it can display mini visualizations in each table cell, which are called micro-charts, and unlike other visualizations can display a large number of data variables.
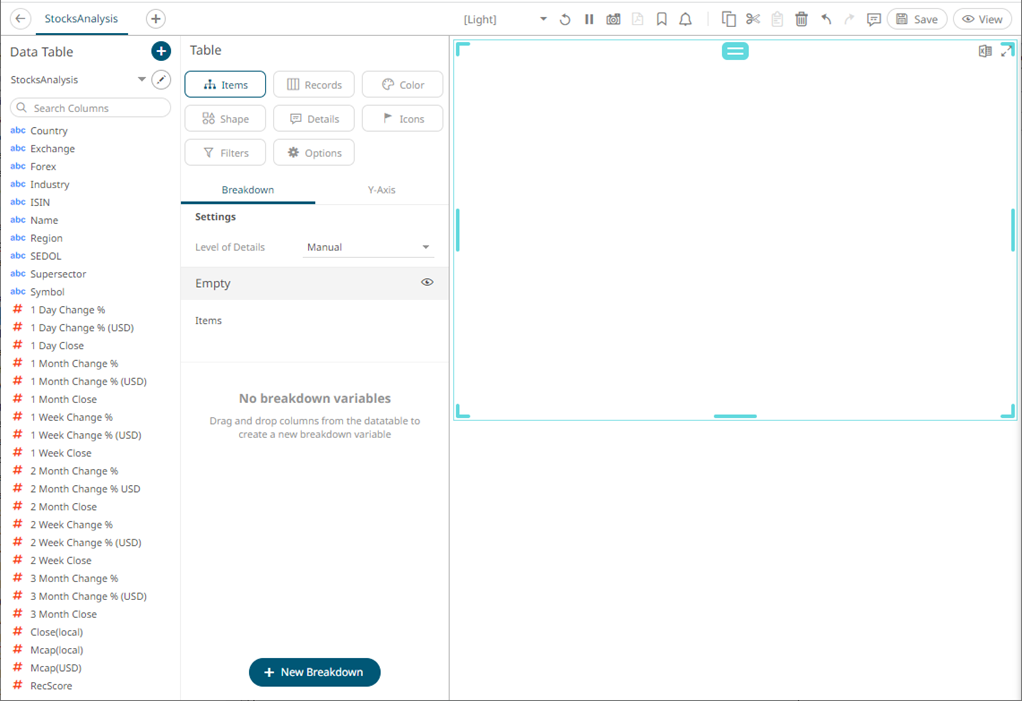
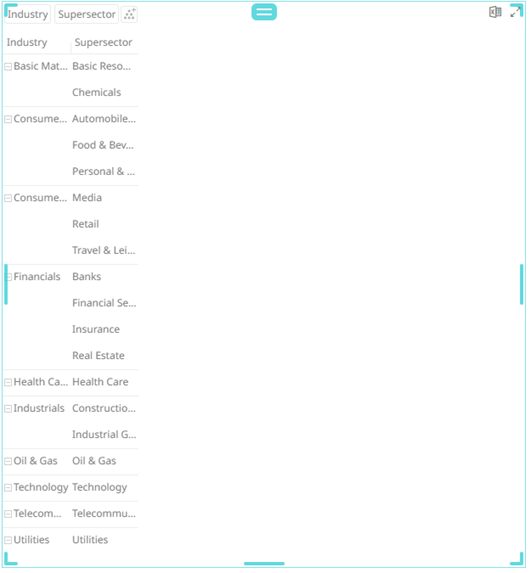
Each row of the Table is defined by the hierarchy, added to the breakdown. If there are too many rows, a vertical scroll bar will be displayed.
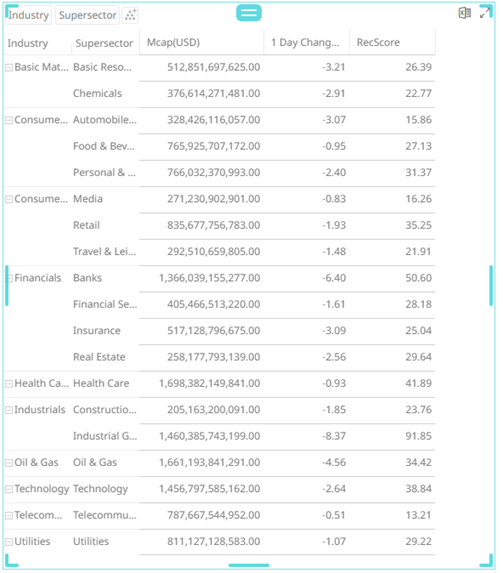
Dragging columns from the Data Table pane to the Records variable drop area creates the columns of the table.
If there are too many columns, a horizontal scroll bar will be displayed:
Color and Icons are added as with other visualizations.
Aside from being displayed as Text, visual numeric columns can also be configured to these visualizations:
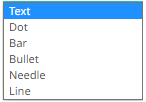
Static numeric data:
q Dot
q Bar
q Bullet
Time series numeric data:
q Needle
q Line