


|
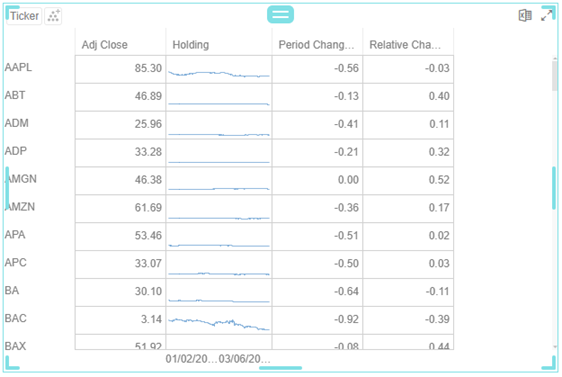
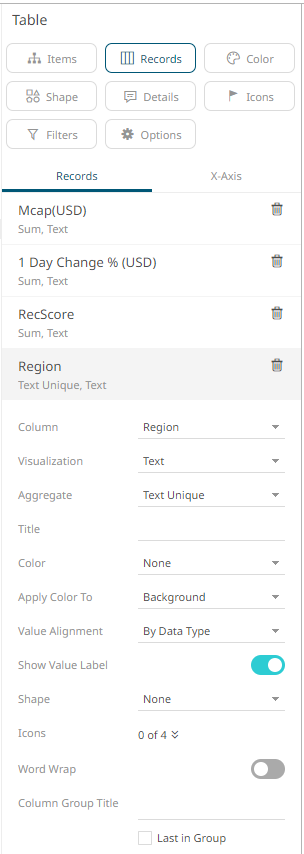
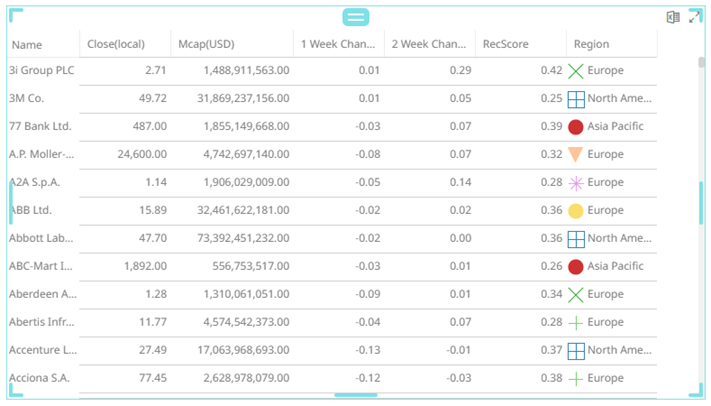
Records Variable Configuration for the Table Visualization
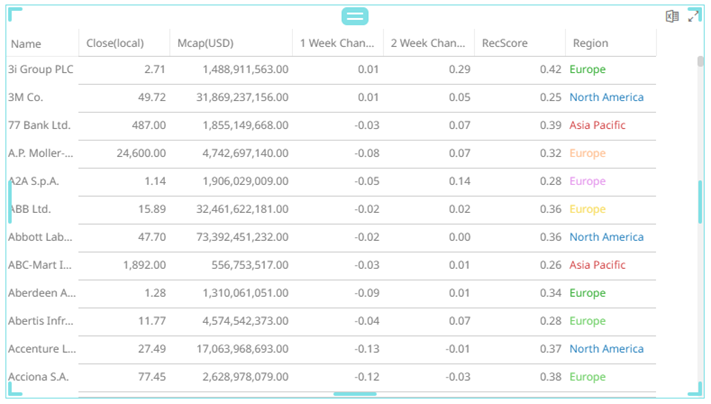
The configuration of the records added to the table visualization will depend on how the numeric or text columns will be displayed:
Steps:
1. Click on a numeric column under the Records variable list.
This displays the configuration pane.
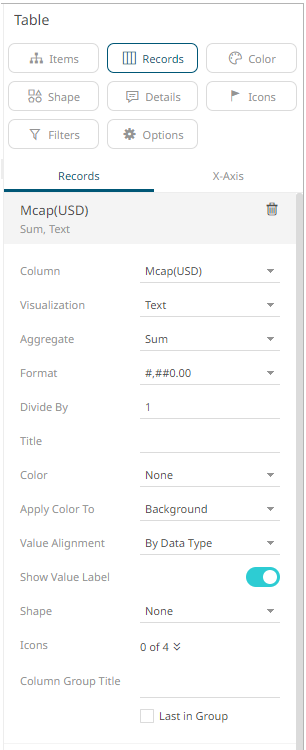
2. You can opt to change the column to the be used as the Records variable from the Column drop-down list.
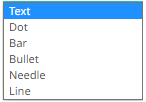
3. Select how the column values will be displayed:
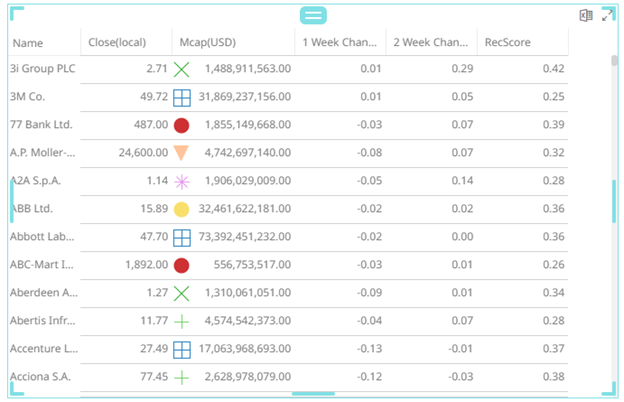
· Text
This visualization type displays the following configuration settings:
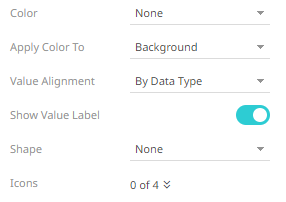
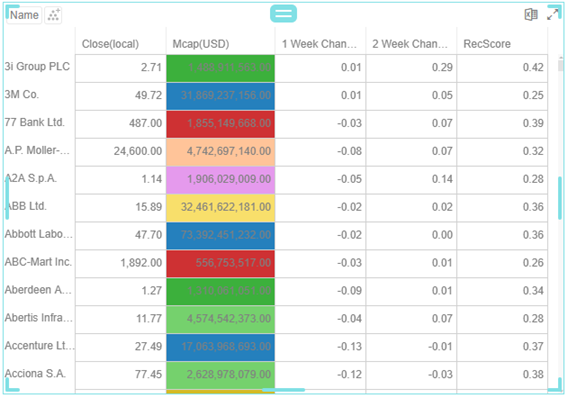
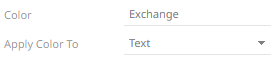
¨ Specify to what the color variable selected will be applied to:
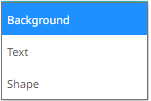
o Background

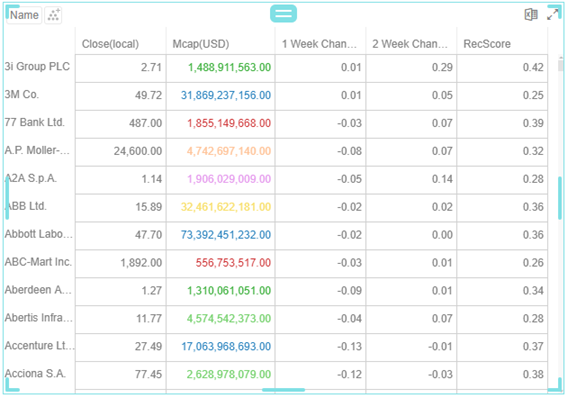
o Text

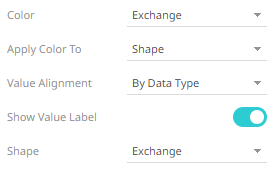
o Shape
Displaying the shape is a useful visual cue in a table. Users will be able to build a legend that will display each unique combination of shape and color, along with the values from the columns used for shape and color.
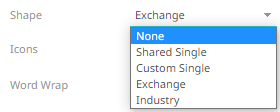
When selecting Shape as the Apply Color To value, ensure to select the Shape value in the drop-down list.

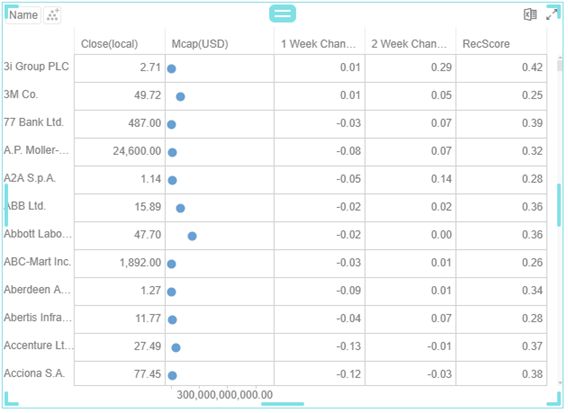
¨ Select the Value Alignment
By default, By Data Type is selected. This means, for text values, it is aligned to the left. For numeric or Data/Time data type, the value is aligned to the right.
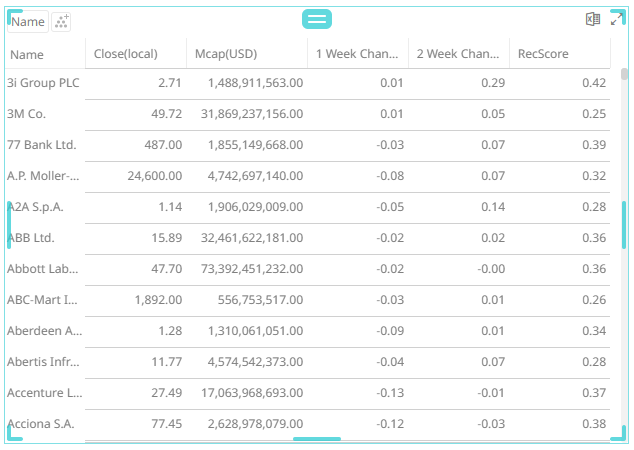
¨ Tap the Show Value Label slider to display the column values.
¨ Click the Icons drop-down and check the boxes of the columns with icons that will be assigned for this particular column.
![]()
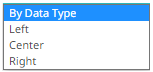
· Horizontal Dot Plot
This visualization type displays the following configuration settings:
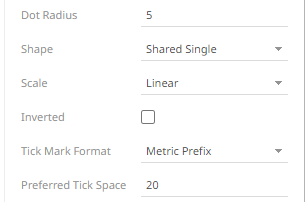
¨ Set the Dot Radius. Default is 5.
¨ Select the Shape that will be applied to the dot plot.
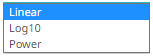
¨ Select whether the Scale of the axis is Linear, Log10, or Power.
¨ Check the Inverted box. The dot plots on the x-axis is inverted.
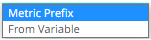
¨ Select whether Tick Mark Format will be Metric Prefix or From Variable.
¨ Enter the Preferred Tick Space. Default is 20.
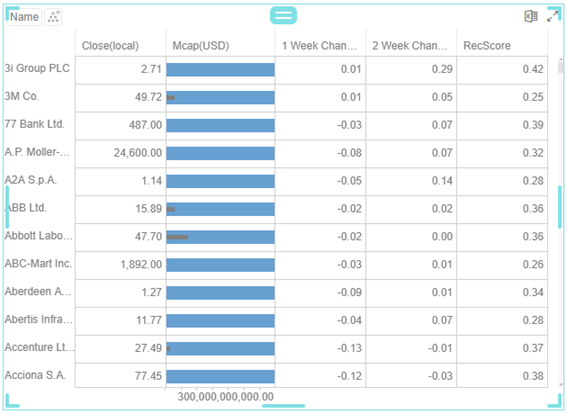
· Horizontal Bar Graph
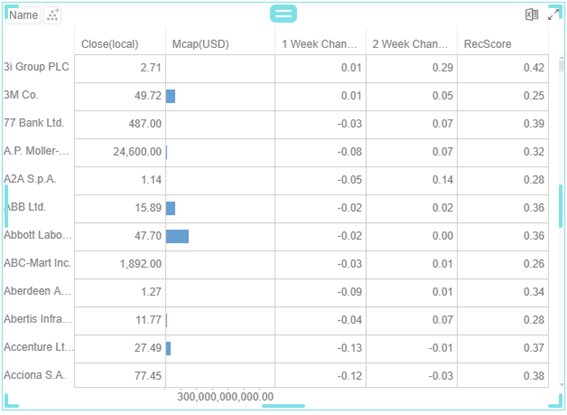
This visualization type displays the following configuration settings:
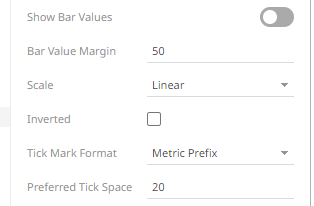
¨ Tap the Show Bar Values slider to display the bar values.
¨ Set wether the Scale will be Linear or Power.
¨ Check the Inverted box. The bar graph on the x-axis is inverted.
¨ Select whether Tick Mark Format will be Metric Prefix or From Variable.
¨ Enter the Preferred Tick Space. Default is 20.
· Horizontal Bullet Graph
This visualization type displays the following configuration settings:
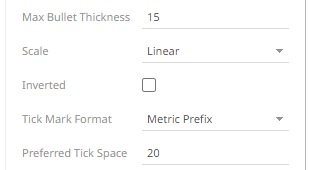
¨ Enter the Max Bullet Thickness. Default is 15.
¨ Set wether the Scale will be Linear or Power.
¨ Check the Inverted box. The bullet graph on the x-axis is inverted.
¨ Select whether Tick Mark Format will be Metric Prefix or From Variable.
¨ Enter the Preferred Tick Space. Default is 20.
· Needle Graph (time series data)
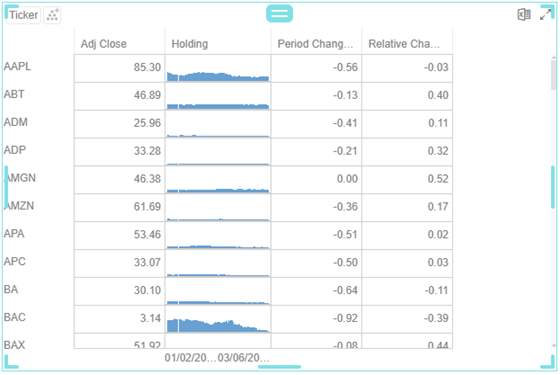
This visualization type displays the following configuration settings:
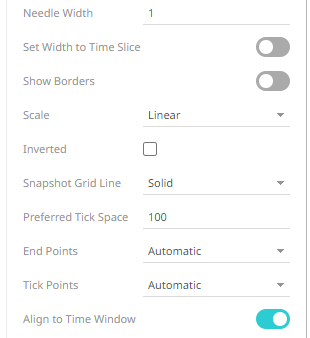
¨ Enter the Needle Width. Default is 1.
¨ Tap the Set Width to Time Slice slider for the needle width to be extended to the width of the time slice.
¨ Tap the Show Borders slider to display the borders.
¨ Set wether the Scale will be Linear or Power.
¨ Check the Inverted box. The needle graph on the x-axis is inverted.
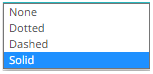
¨ Set the Snapshot Grid Line.
¨ Enter the Preferred Tick Space. Default is 20.
¨ Set the End Points.
o Automatic – automatically displays the end points.
o None – end points are not displayed.
o Custom – allows the selection of the Date/Time format of end points.
¨ Set the Tick Points.
o Automatic – automatically displays the tick points.
o None – tick points are not displayed.
o Custom – allows the selection of the Date/Time format of tick points.
¨ Enable Align to Time Window to align with the time window of the Time Filter Box.
· Line Graph (time series data)
This visualization type displays the following configuration settings:
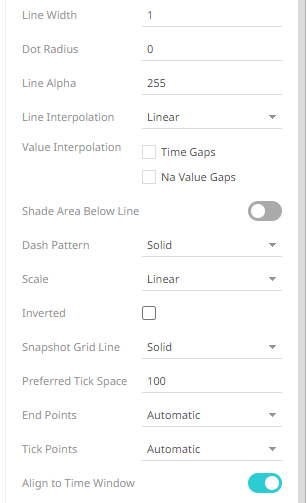
¨ Enter the Line Width. Default is 1.
¨ Enter the Dot Radius of each data point.
¨ Enter the Line Alpha which is the level of color transparency/opacity. Default is 255.
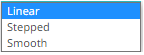
¨ Select the whether the Line Interpolation will be Linear, Steeped, or Smooth.
¨ Check the Time Gaps box for the time axis gaps to be interpolated.
¨ Check the Na Value Gaps box for the Na value gaps to be interpolated.
¨ Tap the Shade Area Below Line slider to apply the alpha shades between the lines and the zero Y grid line.
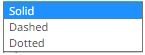
¨ Select where the Dash Pattern will be Solid, Dashed, or Dotted.
¨ Set wether the Scale will be Linear or Power.
¨ Check the Inverted box. The line graph on the X axis is inverted.
¨ Set the Snapshot Grid Line.
¨ Enter the Preferred Tick Space. Default is 100.
¨ Set the End Points.
o Automatic – automatically displays the end points.
o None – end points are not displayed.
o Custom – allows the selection of the Date/Time format of end points.
¨ Set the Tick Points.
o Automatic – automatically displays the tick points.
o None – tick points are not displayed.
o Custom – allows the selection of the Date/Time format of tick points.
¨ Enable Align to Time Window to align with the time window of the Time Filter Box.
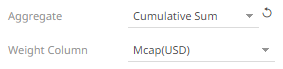
4. Select the aggregation method in the Aggregate field.
The default is Sum.
· If you set the aggregation method to Intercept, Slope, Weighted Mean, Weighted Harmonic Mean, Percent of Total Reference, Weighted Sum, Percent of Parent Reference, Percent of Total Change, or Cumulative Sum by Max, the Weight Column drop-down list is enabled and displays a list of numeric data columns in the selected data table that can be used as the weight column for the aggregate.
· If you set the aggregation method to Percentile, the Percentile field is displayed. Specify the value that can be used to calculate the value of the selected percentile.
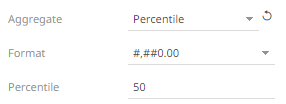
5. The Format field lets you specify the format that numbers will be displayed in. Panopticon uses the same formatting rules as Excel.
6. Select the Divide By value to divide a number:
· 1
· 1000 (by a thousand)
· 10000
· 1000000 (by a million)
· 1000000000 (by a billion)
7. Enter the Title of the column.
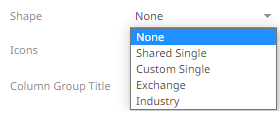
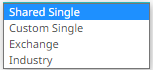
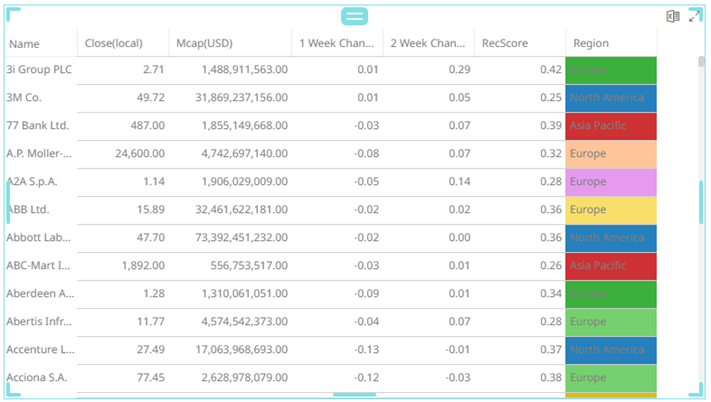
8. Select the Color variable that will be used for the column:
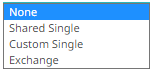
· None
· Shared Single
· Custom Single
· Column added to the Color variable (e.g., Exchange)
9. You can also opt to group columns in the Table visualization.
10. Click the Save  icon on the toolbar.
When
saved, the  notification
is displayed.
notification
is displayed.
You can add text records in a similar way.
Steps:
1. Click on a text column under the Records variable list.
This displays the configuration pane.
2. You can opt to change the column to the be used as the Records variable from the Column drop-down list.
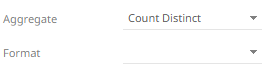
3. By default, text colums are displayed as Text. Select the text aggregation method from the Aggregate field: Count Distinct, Text Unique, or Text Concat Distinct.
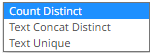
The default is Text Unique.
For Count Distinct, select the Format.
4. Enter the Title of the column.
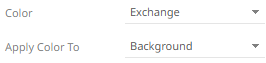
5. Select the Color variable that will be used for the column:
· None
· Shared Single
· Custom Single
· Column added to the Color variable (e.g., Exchange)
6. Specify to what the color variable selected will be applied to:
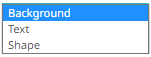
· Background
· Text
· Shape
Displaying the shape is a useful visual cue in a table. Users will be able to build a legend that will display each unique combination of shape and color, along with the values from the columns used for shape and color.
When selecting Shape as the Apply Color To value, ensure to select the Shape value in the drop-down list.
7. Select the Value Alignment.
By default, By Data Type is selected. This means, for text values, it is aligned to the left. For numeric or Data/Time data type, the value is aligned to the right.
8. Tap the Show Value Label slider to display the column values.
9. Click the Icons drop-down and check the boxes of the columns with icons that will be assigned for this particular column.
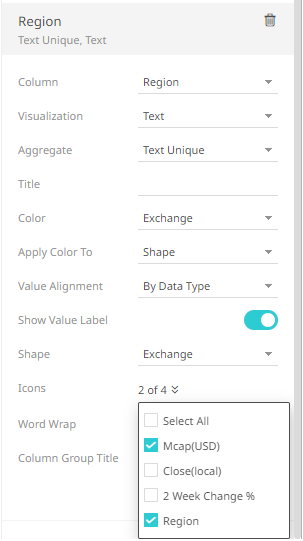
10. Tap the Word Wrap slider to wrap the text of the column values.
11. You can also opt to group columns in the Table visualization.
12. Click the Save icon on the toolbar.
When
saved, the notification
is displayed.