|
Box Plot Settings
Box Plots are designed to display numeric distributions.
The plot draws the Minimum, 25th Percentile, Median, 75th Percentile, and Maximum of the specified measure by category.
This can be provided as a single measure, where Panopticon performs the aggregation.
Or as separate measures for each component of the box plot, where the data source performs the aggregation.
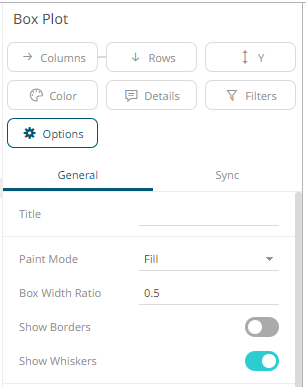
The box plot
settings pane is displayed after clicking the Options  button
|
Setting |
Description |
|
Paint Mode |
The no fill color. Possible values: Fill or Border. |
|
Box Width Ratio |
Defines the ratio between boxes and the space within each box. Default is 0.5. |
|
Show Borders |
Determines whether borders are drawn around the box. Disabled when the Paint Mode is set to Border. |
|
Show Whiskers |
Determines whether to display lines extending vertically from the boxes, indicating variability outside the upper and lower quartiles. |
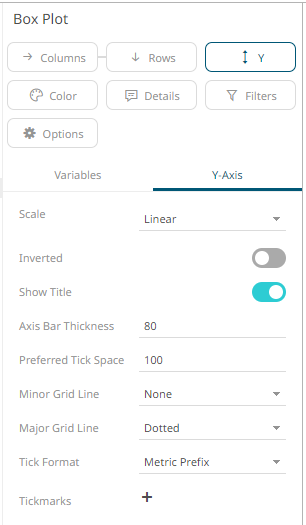
Other visualization-specific properties can be set by clicking on the Y-Axis variable drop area and then selecting the Y-Axis tab: