|
Dot Plot Settings
Dot Plots have two primary use cases:
q A more effective alternative to a Bar Graph
q A distribution display similar to a Scatter Plot
Dot Plots are an effective alternative to Bar Graphs, particularly in cases where the data being analyzed contains many similar numeric values.
In comparison with the Bar Graph, Dot Plots do not use a zero baseline and are less cluttered. This makes it easier to add additional data variables to the visualization.
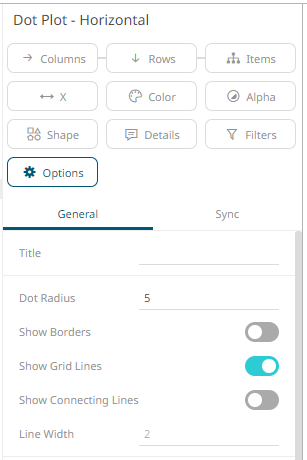
The dot plot
settings pane is displayed after clicking the Options  button.
|
Setting |
Description |
|
Dot Radius |
Specifies the radius of each dot in pixels. |
|
Show Borders |
Determines whether a border is drawn around each dot. |
|
Show Grid Lines |
Determines whether grid lines are drawn through each dot. |
|
Show Connecting Lines |
Determines whether a line is drawn between the dots category constituents. Allows a categorical line graph to be displayed. |
|
Line Width |
Specifies the width in pixels of the line if enabled. |
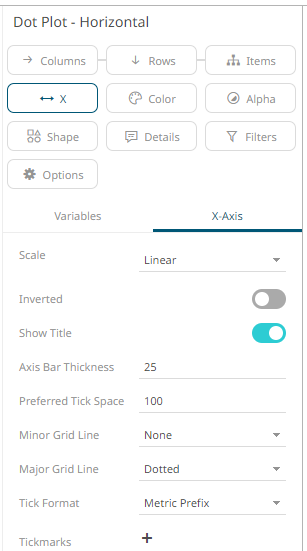
Other visualization-specific properties can be set by clicking on either:
q Y-Axis variable drop area then selecting the Y-Axis tab (for Vertical Dot Plots) or
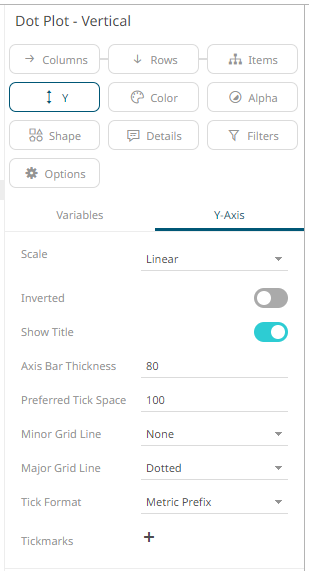
q X-Axis variable drop area then selecting the X-Axis tab (for Horizontal Dot Plots)