|
Numeric Needle Graph Settings
Numeric Needle Graphs display price distributions.
Unlike a traditional Bar Graph, the X Axis is numeric rather than categorical. Bars are positioned along the X axis according to their X value, and their height is determined by their Y values. For the Horizontal variant, the X Axis represents the height, and the Y axis the price.
This allows gaps, and clustering in price to be more accurately identified, and are typically used for displaying price distributions and order book displays.
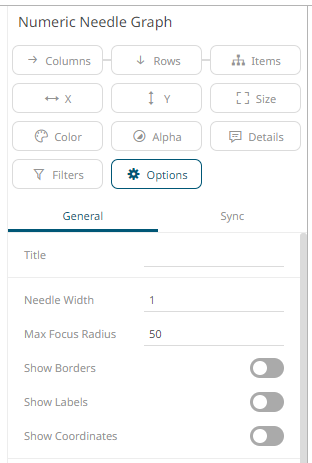
The numeric
needle graph settings pane is displayed after clicking the Options  button.
|
Setting |
Description |
|
Needle Width |
Specifies the width in pixels of each needle: NOTE: This is overridden when a column is added in the Size variable. Consequently, the width of the needles will be based on the comparison of their size in relation to where they are located on the X axis. |
|
Max Focus Radius |
Determines the maximum radius of the focus circle when hovering on the needles. This also controls the padding of the axis in the direction in which the needles expand, allowing the focus circle to have enough space to be drawn. |
|
Show Borders |
Specifies whether a border is drawn around needles. These are only visible if the Needle Width is greater than 1 pixel. |
|
Show Labels |
Specifies whether node labels will be displayed. |
|
Show Coordinates |
Determines whether the graph coordinates (i.e., X-Y plots, or Date/Time-Y plots) on mouse over are displayed in the visualization. |
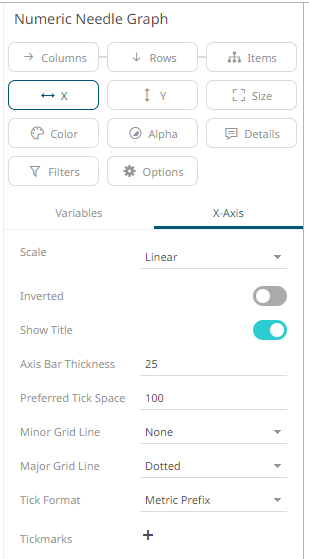
Other visualization-specific properties can be set by clicking on the X-Axis variable drop area and then selecting the X-Axis tab:
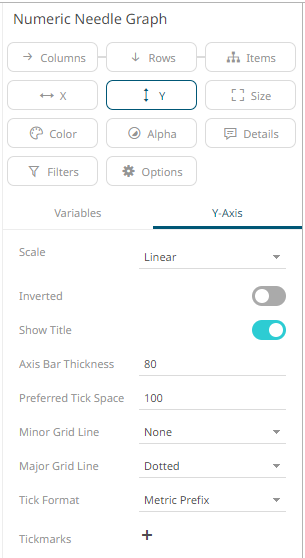
Or also, by clicking on the Y-Axis variable drop area and then selecting the Y-Axis tab: