


|
Shapes Settings
The Shapes visualization allows the display of Choropleth Graphs and other displays built from SVG Paths.
The Shapes visualization can be used to display data where both physical location and size are important.
They clearly show data correlations and clustering that is geospatial in nature.
Unlike the Geographic Scatter Plot, the size of each shape is fixed, imparting the importance of the item. As a consequence, data should be relative to each shape size, such as area densities.
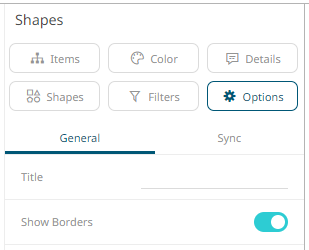
The shapes
settings pane is displayed after clicking the Options  button.
|
Setting |
Description |
|
Show Borders |
Determines whether borders are visible around each shape. |