


|
Ticker Tile Settings
The Ticker Tile is used to display three metrics, typically:
q Price
q Change in Price
q % Change in Price
Where the price is displayed in a double height label, the change in price to the bottom left of the tile, and the color shown as the background of the tile, and the numeric value displayed in the bottom right of the tile.
Icons can also be added to the tile to indicate the change in other metrics.
As with all visualizations, as data changes the tile will automatically update.
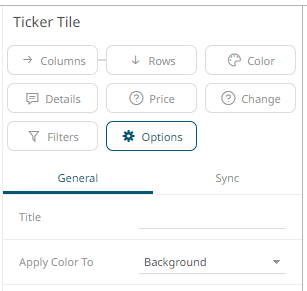
The ticker
tile settings pane is displayed after clicking the Options  button.
|
Setting |
Description |
|
Apply Color To |
Sets how the color variable is displayed: Background or Text |