


|
Retrieving External Aggregates (Non Additive Data Sets)
In general, Panopticon Real Time processes data that itself can aggregate through standard aggregation methods, including Sum, Min, Max, Mean, and so on. However, there may be occasions when aggregate values cannot be calculated internally but must be retrieved separately.
When working with financial risk data, especially Value at Risk (VaR) the data will be by definition non-additive and cannot be calculated internally within Panopticon Real Time. As a consequence, we allow aggregates to be retrieved in addition to the base data set. Configuration of the External aggregate can be supplied explicitly by the user or implicitly from the data plug-in.
An example workbook demonstrating this principle for both static snapshots and Time Series named How to Non Additive is included with the product.
An example data format is included below, which first lists the lowest level data, followed by the aggregates. The Column titled Desk defines whether the row is aggregate or a leaf value.
|
Global |
Region |
Country |
Office |
Desk |
Exposure |
10 VaR |
1 VaR |
|
Global |
North America |
USA |
Boston |
Boston|Equity |
502.5591 |
96.93133 |
34.38913 |
|
Global |
North America |
Canada |
Toronto |
Toronto|Commodities |
449.1171 |
83.44991 |
26.30474 |
|
Global |
North America |
USA |
Chicago |
Chicago|Commodities |
652.1543 |
76.20758 |
2.714785 |
|
Global |
North America |
USA |
New York |
New York|FX |
517.6406 |
71.2854 |
37.26238 |
|
Global |
North America |
USA |
Los Angeles |
Los Angeles|Mutual Funds |
182.0767 |
67.68958 |
11.1428 |
|
Global |
North America |
USA |
New York |
New York|Mutual Funds |
812.583 |
64.44671 |
40.76365 |
|
Global |
North America |
USA |
Los Angeles |
Los Angeles|Equity |
471.5469 |
39.9832 |
39.31864 |
|
Global |
North America |
USA |
New York |
New York|Commodities |
369.0428 |
39.51506 |
46.6825 |
|
Global |
North America |
USA |
Chicago |
Chicago|Fixed Income |
459.5511 |
33.45534 |
17.68969 |
|
Global |
North America |
USA |
New York |
New York|Fixed Income |
701.7921 |
31.34119 |
43.45796 |
|
Global |
North America |
USA |
New York |
New York|Equity |
810.3085 |
30.91666 |
20.31064 |
|
Global |
North America |
USA |
Chicago |
Chicago|FX |
77.76167 |
23.44857 |
41.05015 |
|
Global |
North America |
USA |
Los Angeles |
Los Angeles|FX |
285.2182 |
22.41497 |
18.51936 |
|
Global |
North America |
Canada |
Toronto |
Toronto|Equity |
909.3673 |
16.85309 |
30.22478 |
|
Global |
North America |
USA |
Boston |
Boston|Fixed Income |
305.9504 |
12.37541 |
3.2304 |
|
Global |
North America |
Canada |
Vancouver |
Vancouver|Commodities |
260.9837 |
10.91653 |
13.70787 |
|
Global |
North America |
Canada |
Toronto |
|
1358.484 |
75.7861 |
51.20194 |
|
Global |
North America |
Canada |
Vancouver |
|
260.9837 |
8.24374 |
8.960773 |
|
Global |
North America |
USA |
Boston |
|
1065.943 |
130.6419 |
27.43908 |
|
Global |
North America |
USA |
Chicago |
|
1601.07 |
145.2946 |
67.41181 |
|
Global |
North America |
USA |
Los Angeles |
|
938.8418 |
82.48388 |
41.31485 |
|
Global |
North America |
USA |
New York |
|
3211.367 |
122.2747 |
161.8823 |
|
Global |
North America |
Canada |
|
|
1619.468 |
99.31398 |
54.7861 |
|
Global |
North America |
USA |
|
|
6817.222 |
518.8613 |
289.0221 |
|
Global |
North America |
|
|
|
8436.69 |
566.3662 |
392.1354 |
|
Global |
|
|
|
|
20990.08 |
1626.839 |
1104.829 |
To retrieve external aggregates:
1. Retrieve your data set including both base data, plus aggregate data.
2. On the Data Table Settings pane, tap the Includes Aggregate Data slider to turn it on and then select the text column that defines the leaf.
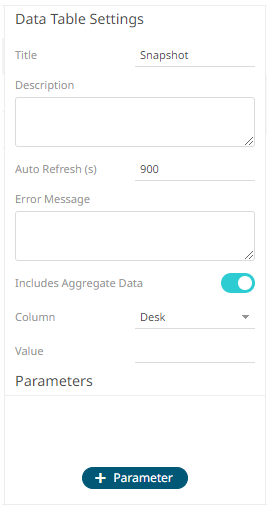
3. Enter the Value to determine aggregate rows. The default being blank.
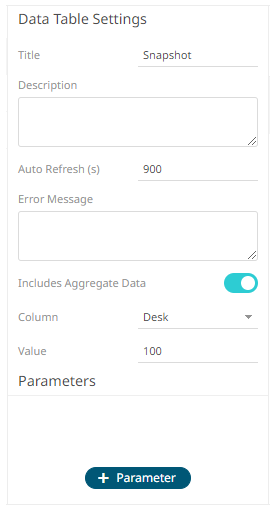
4. Click the Save  button.
|
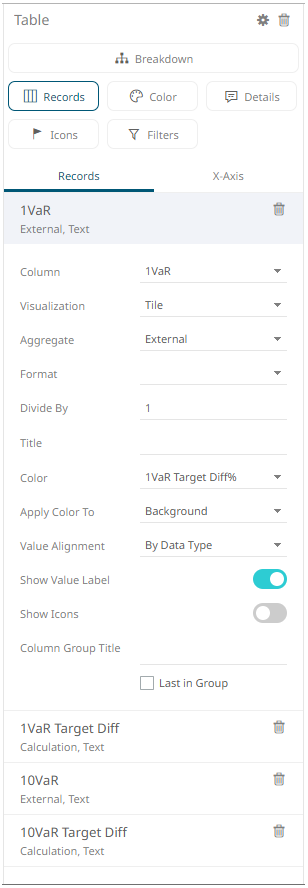
NOTE |
Within the visualization, the default aggregation method for all variables will be set to External.
|
As long as the leaf or lowest level of data is identified by selecting a specific categorical column, multiple non-additive hierarchies can be supported. In these cases, the aggregates must be supplied, where every column to the left of the selected column, is defined as a potential aggregate.
For example, the following dataset includes the hierarchy:
Global à Region à Country à Office à Asset Class -- > Desk
It includes the base data for each desk, plus aggregates for:
Global à Region à Country à Office à Asset Class
Global à Region à Country à Office
Global à Region à Country
Global à Region
Global
Additionally, aggregates have been supplied for the different hierarchy:
Global à Asset Class à Region àCountry à Office à Desk
Global à Asset Class à Region àCountry à Office
Global à Asset Class à Region àCountry
Global à Asset Class à Region
Global à Asset Class
|
Global |
Region |
Country |
Office |
AssetClass |
Desk |
10 VaR |
1 VaR |
|
Global |
North America |
USA |
Boston |
Equity |
Boston|Equity |
96.93133048 |
34.38913175 |
|
Global |
North America |
USA |
New York |
FX |
New York|FX |
71.28540032 |
37.26238164 |
|
Global |
North America |
USA |
New York |
Fixed Income |
New York|Fixed Income |
31.34118784 |
43.45795678 |
|
Global |
North America |
USA |
New York |
Equity |
New York|Equity |
30.91665946 |
20.31063719 |
|
Global |
North America |
Canada |
Toronto |
Equity |
Toronto|Equity |
16.85309075 |
30.22477718 |
|
Global |
North America |
USA |
Boston |
Fixed Income |
Boston|Fixed Income |
12.37540616 |
3.230399924 |
|
Global |
North America |
USA |
Boston |
Equity |
TOTAL |
96.93133048 |
34.38913175 |
|
Global |
North America |
USA |
New York |
FX |
TOTAL |
71.28540032 |
37.26238164 |
|
Global |
North America |
USA |
New York |
Fixed Income |
TOTAL |
31.34118784 |
43.45795678 |
|
Global |
North America |
USA |
New York |
Equity |
TOTAL |
30.91665946 |
20.31063719 |
|
Global |
North America |
Canada |
Toronto |
Equity |
TOTAL |
16.85309075 |
30.22477718 |
|
Global |
North America |
USA |
Boston |
Fixed Income |
TOTAL |
12.37540616 |
3.230399924 |
|
Global |
North America |
Canada |
Toronto |
TOTAL |
TOTAL |
75.78610302 |
51.2019375 |
|
Global |
North America |
USA |
Boston |
TOTAL |
TOTAL |
130.6419004 |
27.43907688 |
|
Global |
North America |
USA |
New York |
TOTAL |
TOTAL |
122.2746767 |
161.882264 |
|
Global |
North America |
Canada |
TOTAL |
TOTAL |
TOTAL |
99.31398318 |
54.78609529 |
|
Global |
North America |
USA |
TOTAL |
TOTAL |
TOTAL |
518.8613204 |
289.0221365 |
|
Global |
North America |
TOTAL |
TOTAL |
TOTAL |
TOTAL |
566.366159 |
392.1354295 |
|
Global |
TOTAL |
TOTAL |
TOTAL |
TOTAL |
TOTAL |
1626.839172 |
1104.828695 |
|
Global |
TOTAL |
TOTAL |
TOTAL |
Equity |
TOTAL |
606.4144769 |
329.4784359 |
|
Global |
TOTAL |
TOTAL |
TOTAL |
Fixed Income |
TOTAL |
451.081016 |
178.6103631 |
|
Global |
North America |
TOTAL |
TOTAL |
Equity |
TOTAL |
192.2519763 |
122.2667907 |
|
Global |
North America |
TOTAL |
TOTAL |
Fixed Income |
TOTAL |
65.59614378 |
54.72134119 |
|
Global |
North America |
TOTAL |
TOTAL |
FX |
TOTAL |
99.57659408 |
82.30710941 |
|
Global |
North America |
USA |
TOTAL |
Equity |
TOTAL |
188.3931344 |
102.2566554 |
|
Global |
North America |
Canada |
TOTAL |
Equity |
TOTAL |
15.16778167 |
27.20229946 |
|
Global |
North America |
USA |
TOTAL |
FX |
TOTAL |
105.4340408 |
87.14870408 |